
What is an Infographic? Infographic Definition, Key Elements & Applications in Digital Marketing
Discover what an infographic is, its core components, and how infographics drive brand visibility and engagement in digital marketing and AI search optimization. Learn practical applications, design tips, and how platforms like Geneo help brands optimize infographic performance for better search rankings.
One-Sentence Definition
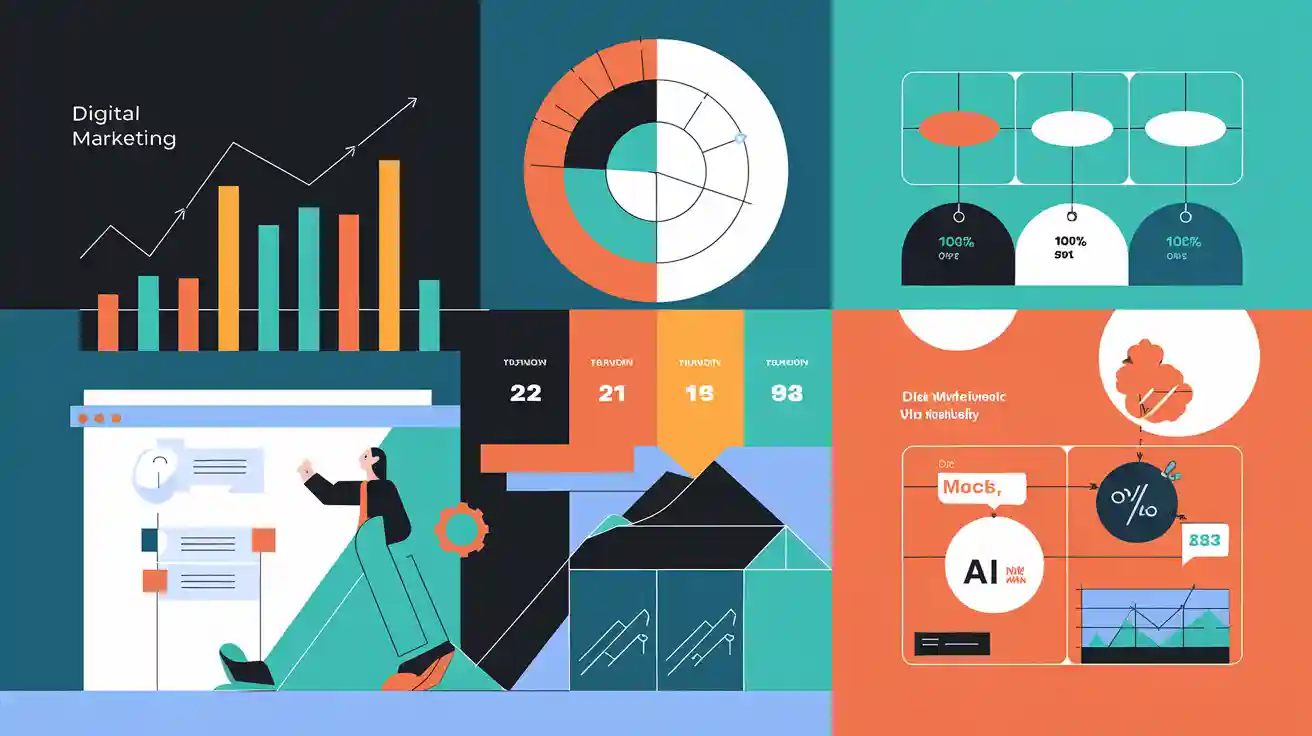
An infographic is a visual representation that combines images, charts, and concise text to present information or data in a clear and engaging way.
Detailed Explanation
Infographics are designed to simplify complex topics by translating data and concepts into visually compelling formats. By leveraging elements like charts, icons, and minimal text, infographics make information easy to understand at a glance. According to Venngage and Wikipedia, infographics enhance cognition by helping viewers quickly identify patterns and trends, making them a powerful tool for communication in digital marketing, education, journalism, and business intelligence.
Key Components of an Infographic
Visual Hierarchy: A clear structure that guides the viewer’s eye, emphasizing the most important information.
Data Visualizations: Charts, graphs, and icons that turn raw data into digestible visuals.
Concise Messaging: Short, impactful text that supports the visuals without overwhelming the viewer.
Color and Typography: Consistent color schemes and readable fonts that enhance clarity and brand alignment.
Accurate Data: Reliable, well-cited information to ensure credibility and trust.
Real-World Applications
Infographics are widely used to:
Summarize research findings or survey results
Explain complex processes or workflows
Compare products, services, or concepts
Raise awareness about issues or causes
Boost brand visibility and engagement on social media
In the context of AI search optimization and digital marketing, platforms like Geneo enable brands to monitor and analyze the performance of their infographics across AI-driven search engines (e.g., ChatGPT, Google AI Overview, Perplexity). By tracking visibility and engagement, marketers can optimize infographic content to improve search rankings and brand exposure. For example, a brand might use Geneo to identify which infographic designs perform best in AI search results, then refine their content strategy accordingly.
Related Concepts
Data Visualization: The broader practice of representing data graphically, of which infographics are a subset. Learn more.
Content Marketing: Using valuable content, including infographics, to attract and engage audiences.
Brand Storytelling: Communicating a brand’s message through visual narratives.
Graphic Design: The art and practice of planning and projecting ideas with visual and textual content.
Charts & Diagrams: While these are components of infographics, they typically focus on a single data set or relationship, whereas infographics combine multiple elements to tell a broader story.
Visual Enhancement
To maximize the impact of your infographics:
Use a structure diagram to break down the infographic’s layout (e.g., header, data section, conclusion).
Incorporate a content optimization flowchart to illustrate how data is selected, visualized, and refined for target audiences.
Compare before-and-after examples to show the effect of optimization on engagement and visibility.
Conclusion & Next Steps
Infographics are essential for modern communication, especially in digital marketing and AI-driven content strategies. By combining data, visuals, and concise messaging, they make information accessible and memorable. To further enhance your brand’s visibility in AI search and digital channels, consider leveraging platforms like Geneo for real-time monitoring, optimization, and actionable insights.
Ready to boost your brand’s AI search visibility with smarter infographics? Try Geneo today.