
How to Measure the Impact of GEO-Optimized Content: Complete Guide
Learn how to measure GEO-optimized content impact—step-by-step. Covers local SEO & GEO (AI visibility) tracking, attribution, and reporting for real results.
GEO means two different things in marketing conversations today. There’s “geo‑optimized” content for specific places (your city pages, store‑locator entries, and neighborhood guides). And there’s “GEO” as in Generative Engine Optimization—earning visibility and citations inside AI answers from engines like ChatGPT, Perplexity, and Google’s AI Overview. If you only measure one of these, you’ll miss half the picture.
This guide lays out a unified, reproducible way to quantify impact across both: from baselines and instrumentation to segmentation, reporting, and QA. The goal is a workflow that ties visibility to real outcomes—calls, forms, and visits—without guesswork.
1) Set baselines before you ship
You can’t prove lift if you never captured the “before.” For each location and content set, establish baseline values using equal comparison windows (e.g., 28 days pre‑launch vs. 28 days post‑launch) and document the exact dates.
- Visibility: Google Search Console (GSC) impressions and average position for geo‑intent queries; local pack/organic coverage via rank grids; Google Business Profile (GBP) views. Add a GEO layer by noting your AI citation/share‑of‑voice baseline.
- Engagement: CTR from GSC; GBP website clicks and direction requests; on‑page engagement metrics in GA4.
- Outcomes: Calls, forms, booked appointments, and store visits (when available). Tag these to locations.
Normalize for seasonality with year‑over‑year when you can, especially for categories with holiday peaks or weather effects. The instrumentation in the next section makes these baselines comparable over time.
2) Instrumentation that makes attribution possible
Strong measurement lives or dies on setup. Think of this as tightening the bolts before the car hits the highway.
- GSC filters and patterns: Use Performance filters (Country, Device, Page) and build saved query filters for city/neighborhood terms (e.g., “plumber in Brooklyn,” “near me” variants). For fundamentals and technical prerequisites, see Google’s official SEO basics in the SEO Starter Guide (Google, reference docs).
- GA4 events and UTMs: Track click‑to‑call behavior as a conversion. In Google Tag Manager, fire a custom event (for example, phone_click) on tel: link clicks and send parameters like page_location, phone_number, city/region, and device. For traffic attribution from your GBP, use consistent UTMs (lowercase, standardized fields). BrightLocal outlines practical conventions in its GBP UTM tracking tips (2024, BrightLocal).
- GBP insights and NAP consistency: Monitor profile views, website clicks, calls, and direction requests period‑over‑period. Note that Google removed native call history and chat on July 31, 2024—confirmed in Google Business Profile’s change notice (2024)—so plan third‑party call tracking with care. Keep your canonical phone number as primary, and list tracking numbers as additional where supported to protect NAP consistency.
- Schema for machines: Add LocalBusiness, Organization, and when relevant, FAQPage/HowTo structured data. This improves machine understanding, which can correlate with richer snippets and may help AI engines interpret your content.
3) Segment your data the right way
Good segmentation separates signal from noise—especially across multiple locations.
- In GSC, compare equal windows with these filters: Page contains your location URL pattern (e.g., /locations/), Query includes city or neighborhood terms, and Device=mobile for local intent. Use Country to isolate markets where you operate.
- In GA4, build geo segments (City/Region) and landing‑page groups for your location pages. Break down by source/medium to compare GBP traffic to organic sessions. Mark phone_click (or your equivalent) as a conversion so outcomes show up alongside sessions.
- In GBP, track per‑location website clicks, calls, and direction requests. Compare period‑over‑period and annotate any listing changes (categories, photos, hours) to explain spikes or dips.
- In rank trackers, use a consistent radius and grid density so month‑to‑month trends remain comparable. Tools that visualize geogrids are useful here; for background on what to measure and why, see Local Falcon’s overview on tracking and measuring local SEO performance (Local Falcon).
4) Report local visibility and outcomes
Weekly operational checks keep you close to volatility; monthly rollups tell the story without overreacting to noise. Many practitioners adopt a rhythm similar to AgencyAnalytics’ 2025 guidance on core local metrics—rank coverage, impressions/CTR, and business actions like calls and directions. For a succinct compass, see the 9 key metrics for local SEO (2025, AgencyAnalytics).
Two practical tips:
- Keep a change log. Note content releases, schema deployments, GBP updates, review pushes, and promos. When the numbers move, you’ll have likely causes.
- Use equal windows and fixed settings. Changing grid radius or device mix mid‑stream makes trends unreliable.
Below is a compact KPI map you can adapt. Track at the location level and roll up to region/brand.
| Goal | KPI (what to measure) | Where to get it | Notes |
|---|---|---|---|
| Visibility | GSC impressions and average position for geo queries | GSC Performance | Use query filters with city/neighborhood terms |
| Visibility | Local pack/organic coverage across a geogrid | Rank tracker | Keep radius/grid points consistent across periods |
| Visibility | GBP profile views | GBP Insights | Compare period‑over‑period; annotate listing changes |
| Engagement | CTR on geo queries | GSC Performance | Segment by device; mobile often dominates |
| Engagement | GBP website clicks and direction requests | GBP Insights | Watch for seasonality and store hours changes |
| Outcomes | Phone call conversions | GA4 (custom event) + call tracking | Fire phone_click on tel: links; mark as conversion |
| Outcomes | Forms/appointments | GA4 events/conversions | Tie to location landing pages |
| Outcomes | Store visits (where available) | GBP or POS | Treat as directional if sampling is limited |
5) Add GEO (AI visibility) to your measurement stack
Generative results are changing how people discover brands. You don’t have to guess whether your content is showing up in AI answers—you can measure it.
Core GEO metrics to track monthly:
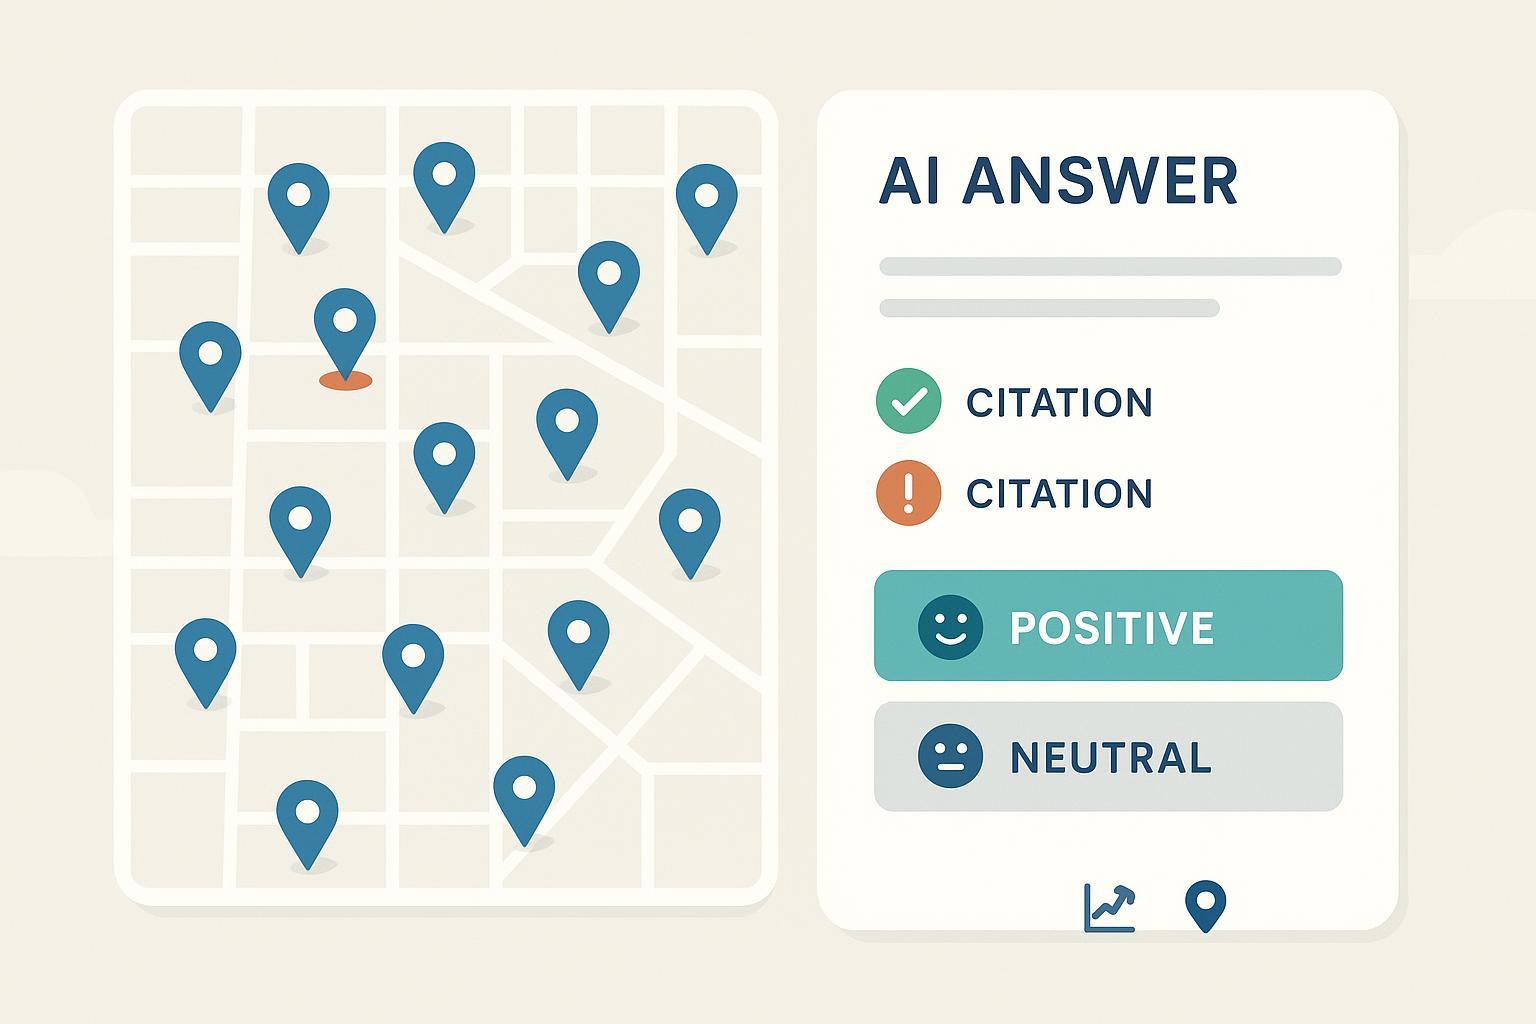
- AI citation rate: How often AI engines cite your pages in answers across a fixed prompt set. Industry frameworks like PromptMonitor’s define presence and share‑of‑voice concepts; see their overview in Generative Engine Optimization metrics (2025, PromptMonitor).
- Brand mention rate: How often your brand appears in answers—even without a clickable citation—segmented by engine and topic cluster.
- Placement quality: The prominence and context of your inclusion (first citation vs. buried, direct recommendation vs. background note). Use a simple rubric to score position and helpfulness.
- Sentiment: Polarity of how your brand is described over time. Combine this with reviews workstreams to diagnose issues.
- AI share of voice (SOV): Your portion of total mentions/citations within a defined category prompt set.
Operationalize it like this:
- Build a representative prompt set per location/service (10–30 queries that mirror real searches and comparisons). Document exact phrasing so month‑to‑month comparisons are apples to apples.
- Capture answers across engines on a set cadence (for example, monthly) and record citations, mention presence, placement score, sentiment, and SOV by topic.
- Blend with analytics: if AI Overview or other AI surfaces send identifiable traffic, segment those sessions and use assisted‑conversion views in GA4 to understand contribution.
For deeper how‑tos, see Geneo’s education posts on AI visibility and GEO measurement, such as the explainer on how GEO tools quantify AI visibility and citations and the step‑by‑step guide to building a GEO monitoring system. If your goal is to actively increase citation frequency, their tutorial on earning AI citations (2025 guide) outlines practical levers and measurement notes.
6) Practical micro‑example (with neutral product disclosure)
Disclosure: Geneo is our product.
A multi‑location home services brand standardizes UTMs on all GBP “Website” links (source=google_business_profile, medium=local_listing, campaign=city), then implements a GA4 phone_click conversion for tel: taps on each location page. After a baseline month, the team fixes NAP inconsistencies and adds LocalBusiness schema. Weekly geogrid scans show broader local pack coverage in high‑density neighborhoods. On the GEO side, a monthly prompt set for “water heater repair [city]” and related comparisons shows an uptick in citations for the brand’s safety checklist content, with sentiment moving from neutral to positive. The combined report ties rising direction requests and call conversions to these optimizations, supported by annotated change logs.
7) QA and troubleshooting checklist
When trends break or plateau, work through a quick, disciplined QA.
- Lost pack visibility: Verify GBP primary/secondary categories, recent reviews and responses, fresh photos, and hours. Confirm NAP consistency on location pages and schema validity. Re‑check your geogrid radius/center.
- Negative or off‑base AI sentiment: Audit top review sources and authoritative pages that AI engines often cite. Publish clarifications with dates and sources; update outdated content; request corrections on factually wrong third‑party claims.
- Missing AI citations: Improve authoritative signals—add structured data, cite primary research, answer definitions directly, and ensure crawlability/canonicals are clean. Expand your prompt set to include the exact questions your buyers ask.
- Fragmented attribution: Standardize UTM naming, ensure phone_click events are marked as conversions in GA4, and confirm that GBP links use the same parameter scheme across locations.
8) What good reporting looks like
Great reporting is boring in the best way: consistent, comparable, and annotated.
- Cadence: Weekly anomaly watch (grid scans, AI snapshots, GBP spikes/drops). Monthly rollups with period‑over‑period comparisons and a one‑page narrative. Quarterly reviews add YOY and cohort views (by location, device, and query cluster). This mirrors what many practitioners recommend for operational clarity—see the practical benchmarks in the AgencyAnalytics 2025 local metrics guide.
- Visualizations: Grid maps for local pack coverage, line charts for GSC impressions/CTR, and a small outcomes table by location (calls, forms, visits). Keep the same scales and radii over time.
- Documentation: Maintain a change log and a configuration log for your rank grids (radius, grid spacing, keywords, scan schedule). When leadership asks “why,” you’ll have the receipts.
Final thoughts
Measurement gets messy when setup varies, windows don’t match, and notes are missing. Pick a simple framework, keep your instrumented events and UTMs consistent, and compare equal periods with fixed settings. Do that, and you’ll be able to say—not guess—how your geo‑optimized and GEO‑optimized content is improving visibility and driving calls, requests, and visits.
References and further reading
- Technical foundations and structured data: the SEO Starter Guide (Google, reference docs)
- UTM conventions for GBP traffic: GBP UTM tracking tips (2024, BrightLocal)
- Local rank grids and measurement concepts: Tracking and measuring local SEO performance (Local Falcon)
- Practical local KPI sets: 9 key metrics for local SEO (2025, AgencyAnalytics)
- GBP feature change (call history/chat sunset): Support notice (2024, Google Business Profile)
- GEO/AI metrics framework: Generative Engine Optimization metrics (2025, PromptMonitor)