
Executive KPIs for GEO: Linking AI Answer Engine Visibility to Revenue
Discover best-practice GEO KPIs—visibility score, share-of-voice, citations, entity coverage—and how to connect AI answer engine visibility to pipeline and revenue for agency dashboards.
Traffic alone won’t earn a seat at the board table when AI answer engines are short‑circuiting the click. Agency leaders need KPIs that prove how visibility inside ChatGPT, Google AI Overview, and Perplexity translates into pipeline and revenue—especially for B2B SaaS with 30–120‑day cycles. This playbook defines defensible GEO metrics, shows how to collect them, blends them with GA4 and CRM multi‑touch attribution, and delivers 90‑day planning bands plus dashboard layouts you can white‑label.
Define the GEO KPIs that execs will trust
Executives care about clarity, comparability, and causal signals. These four KPIs meet that bar when measured consistently.
AI Share‑of‑Voice (AI SoV)
AI SoV captures how often a brand is included in AI‑generated answers compared with its competitors for a defined prompt set.
Citation‑based formula: AI SoV (%) = (Brand citations across prompts ÷ Total citations across all brands for the same prompts) × 100. The approach is consistent with competitive reporting used by enterprise platforms such as Conductor’s competitive AI Share of Voice.
Mention‑based variant: AI SoV (%) = (Number of responses mentioning the brand ÷ Total responses) × 100.
Weighted variant: Apply weights for first mention, recommendation strength, or sentiment where available.
Protocol: Use the same prompt set across engines, re‑run each prompt multiple times, and average to smooth variance.
Citation counts
Citation count tracks the number of times your domain or page is cited within AI answers across the prompt set and timeframe. Segment by engine because behaviours differ: Perplexity typically displays 5–6 citations per answer and shows meaningful overlap with top organic results, as reported by Search Engine Land’s analysis of Perplexity citations (2024). Record direct citations (your domain), indirect citations (syndicated copies), and first‑position citations where the engine indicates a primary source.
Entity coverage
Entity coverage quantifies how much of your primary entity map (company, key products) is correctly recognised and resolved by engines. Operationalise via structured data and canonical identifiers.
Working formula: Entity Coverage (%) = (Primary‑entity keywords with a recognised panel or correct resolution ÷ Total primary‑entity keywords tracked) × 100.
Implementation: Use JSON‑LD for Organisation and Product with stable @id, sameAs, logo, and explicit relationships per schema.org’s Organization and Product types.
AI Visibility Score (composite)
A composite score rolls up frequency and quality signals into a single trend line—useful for executive dashboards but always disclose components and weights. Typical inputs: mentions and citations across engines, sentiment/context where available, extractable content quality, E‑E‑A‑T signals, and freshness. Treat the weighting scheme as transparent and adjustable; scores aren’t yet standardised across the industry.
Build a defensible prompt set and tracking cadence
Your KPI integrity depends on the prompt set and run discipline.
Coverage: Build 20–30 prompts per core topic spanning awareness (“what is”), consideration (“X vs Y”), and bottom‑funnel (“best tool for”).
Engines: Run across ChatGPT, Perplexity, and Google AI Overview. Re‑run each prompt 5–10 times; average to smooth volatility.
Data capture: Log mentions, citations, positions, and sentiment (if available). Annotate which content types are favoured (guides, docs, reviews) and note ecosystems that often surface (e.g., Reddit threads in AI answers).
Why it matters: Google AI Overviews frequently cite sources drawn from top organic results and can depress CTR on informational queries; plan for visibility and recommendation inclusion, not click volume. See GAIn’s guide on optimising for AI Overviews (2025) and Search Engine Land’s reporting on CTR impacts.
Blend GEO with GA4/CRM multi‑touch attribution (without double‑counting)
B2B SaaS agencies should anchor reporting in data‑driven, multi‑touch models by default—then use rule‑based views for diagnostics.
GA4 Data‑Driven Attribution (DDA)
GA4’s DDA allocates credit based on your property’s historical patterns rather than fixed rules. Configure attribution settings and lookback windows in Admin, and use model comparison judiciously.
Mechanics and configuration: See Google’s documentation on attributing credit for key events in GA4.
Platform constraints: Exporting DDA to SA360 has specific thresholds (e.g., recent click and conversion volumes) per SA360’s help guidelines; standard GA4 properties don’t publish a universal minimum for DDA.
CRM full‑path / W‑shaped models
In your CRM, use full‑path or W‑shaped models to weight first touch, lead creation, and opportunity creation. Then reconcile with GA4 DDA so board‑level reporting shows a single, data‑driven view.
Foundations: Salesforce’s multi‑touch attribution primer outlines how to map touches to key stages.
Integration pattern: Connect GA4 conversions to CRM with appropriate identifiers, map to accounts/opportunities, and avoid counting the same influence twice across reporting layers.
Board lens vs diagnostics: For executive slides, stick to data‑driven cross‑channel attribution and show pipeline/revenue deltas. Keep last‑touch/first‑touch views in the appendix for troubleshooting.
90‑day baseline‑to‑target ranges for B2B SaaS
For 30–120‑day cycles, 90 days is enough to establish visibility baselines and detect early pipeline signals. Treat these as planning bands to be localised via a 2–4‑week baseline study of your competitive set.
Maturity band | AI SoV (25‑prompt cross‑engine) | Citation counts (median per 25 prompts) | Entity coverage (primary entities) |
|---|---|---|---|
Early | 5–15% | 5–20 | 30–60% |
Mid | 15–30% | 20–50 | 60–80% |
Leader | 30–50% | 50–100 | 80–95% |
How to use the bands:
Localise: Recalculate bands based on your category’s answer density and the number of brands commonly included per response.
Link to pipeline: Track branded search lift and opportunity creation during weeks 3–12. Where AI answers include your brand as a recommended option, look for rising SQLs linked to those topics.
Interpret deltas: A +10‑point SoV gain with stabilising entity coverage often precedes sustained opportunity creation—particularly in categories where engines regularly recommend two to four vendors per prompt.
Executive‑ready dashboard mock‑ups for agencies
Executives should get to the “so what” in five seconds. Build tiered dashboards that start with the narrative and let users drill into the mechanics.
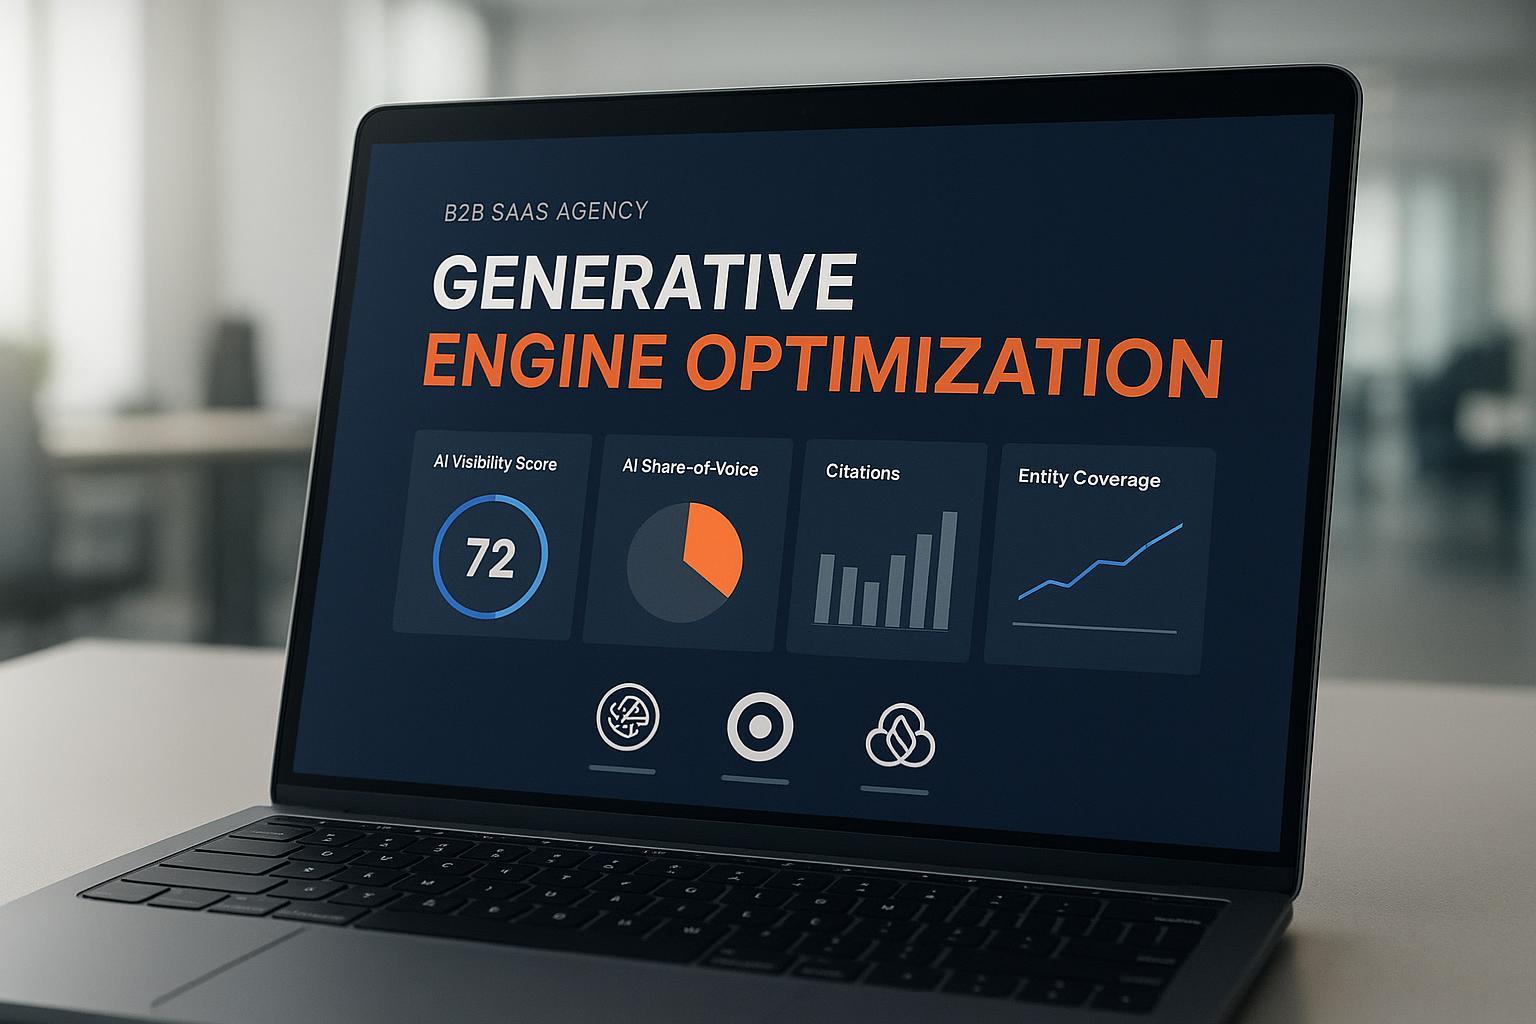
Tier 1 (strategic): ARR/MRR, pipeline generated, AI Visibility Score, AI SoV, citations trend, entity coverage, branded search lift.
Tier 2 (performance breakdown): Engine‑level SoV, prompt‑cluster visibility, competitive deltas, sentiment shifts.
Tier 3 (operational diagnostics): Prompt‑level inclusion, citation sources, schema/entity tasks, page‑level content issues.
Design choices: compact charts, anomaly flags, and sparing use of colour. For layout principles and examples, see Databox’s dashboard best practices.
Neutral tool reference: Platforms such as Geneo’s white‑label AI visibility solution for agencies can produce a Brand Visibility Score and competitor benchmarking across ChatGPT, Perplexity, and Google AI Overview. In practice, agencies roll these into Tier 1 (score trend) and Tier 2 (competitive SoV) panels, alongside GA4/CRM pipeline metrics. Keep the weights and components transparent so executives can connect visibility movements to opportunity creation.
A practical 90‑day execution blueprint
This is a field‑tested cadence agencies can deploy on a B2B SaaS account.
Weeks 0–2: Baseline
Build the 20–30 prompt set per core topic; run across engines daily for 10 days; record mentions, citations, positions, sentiment, and competitors.
Audit and implement Organization/Product schema; stabilise @id and sameAs; add bylines and outbound authority citations on target pages.
Connect GA4 (DDA) and CRM; align conversion events and opportunity stages; define board‑level metrics.
Weeks 3–6: Optimise and attribute
Prioritise content updates for zero‑inclusion prompts: add direct answers, scannable headings, and supporting references.
Expand presence in ecosystems engines favour (e.g., authoritative reviews, community Q&A) where compliant.
Monitor branded search lift and SQL creation; reconcile GA4 DDA with CRM multi‑touch so influence isn’t counted twice.
Weeks 7–12: Stabilise and report
Re‑run prompts daily; compute trend deltas vs baseline; target the planning bands adapted to your category.
Publish an executive dashboard snapshot with competitive SoV and pipeline deltas; annotate interventions and outcomes.
Set quarter‑ahead targets and continue daily runs with monthly roll‑ups.
If an executive asks, “What changed?” you’ll have a crisp story: prompts that moved from zero to inclusion, citations that elevated your content, entity coverage that removed ambiguity, and pipeline that followed.
Guardrails, limitations, and how to defend your story
Composite scores are not standards: Disclose components and weights of any AI Visibility Score. Invite scrutiny on the method rather than the index number.
Planning bands ≠ benchmarks: The 90‑day ranges here are methodology‑driven and must be localised via your baseline study.
Attribution discipline: For board reporting, pick the data‑driven view and stick to it; keep first‑touch/last‑touch for diagnostic appendices.
Evidence over anecdotes: Where possible, pair visibility deltas with corroborating signals—branded search lift, SQL rate by topic, and opportunity creation from AI‑influenced sessions.
Internal resources for agencies (optional further reading)
Ready to measure GEO beyond traffic? Build the prompt set, run daily, publish the tiered dashboard, and align attribution—then let the visibility‑to‑pipeline story compound over the next quarter.