What is Churn Rate? Churn Rate Definition & Digital Marketing Impact
Learn the churn rate definition, formulas, and its importance in digital marketing. Understand how AI predicts churn, reduces loss, and boosts retention.

One-Sentence Definition
Churn rate is the percentage of customers or revenue lost by a company during a specified period — a critical metric for evaluating customer retention and business health (Gartner).
Detailed Explanation
Churn rate, also known as customer attrition rate, quantifies how quickly customers stop doing business with a brand or discontinue a subscription. In digital marketing, SaaS, and brand management, tracking churn reveals not only how many customers are leaving, but also signals shifts in audience sentiment, product fit, or competitive threats. Churn can be measured in two ways:
- Customer Churn Rate: The percentage of customers lost within a period.
- Revenue Churn Rate: The percentage of recurring revenue lost from downgrades or cancellations, emphasizing monetary impact (IBM).
Advanced analyses often distinguish gross churn (total losses) from net churn, which accounts for customers who upgrade or expand their usage. Voluntary churn refers to cancellations by customer choice; involuntary churn includes losses due to failed payments or account issues.
Key Components and Calculation
-
Customer Churn Rate Formula:
(Number of Customers Lost ÷ Customers at Start of Period) × 100 -
Revenue Churn Rate Formula:
(Recurring Revenue Lost from Churn ÷ Recurring Revenue at Start) × 100
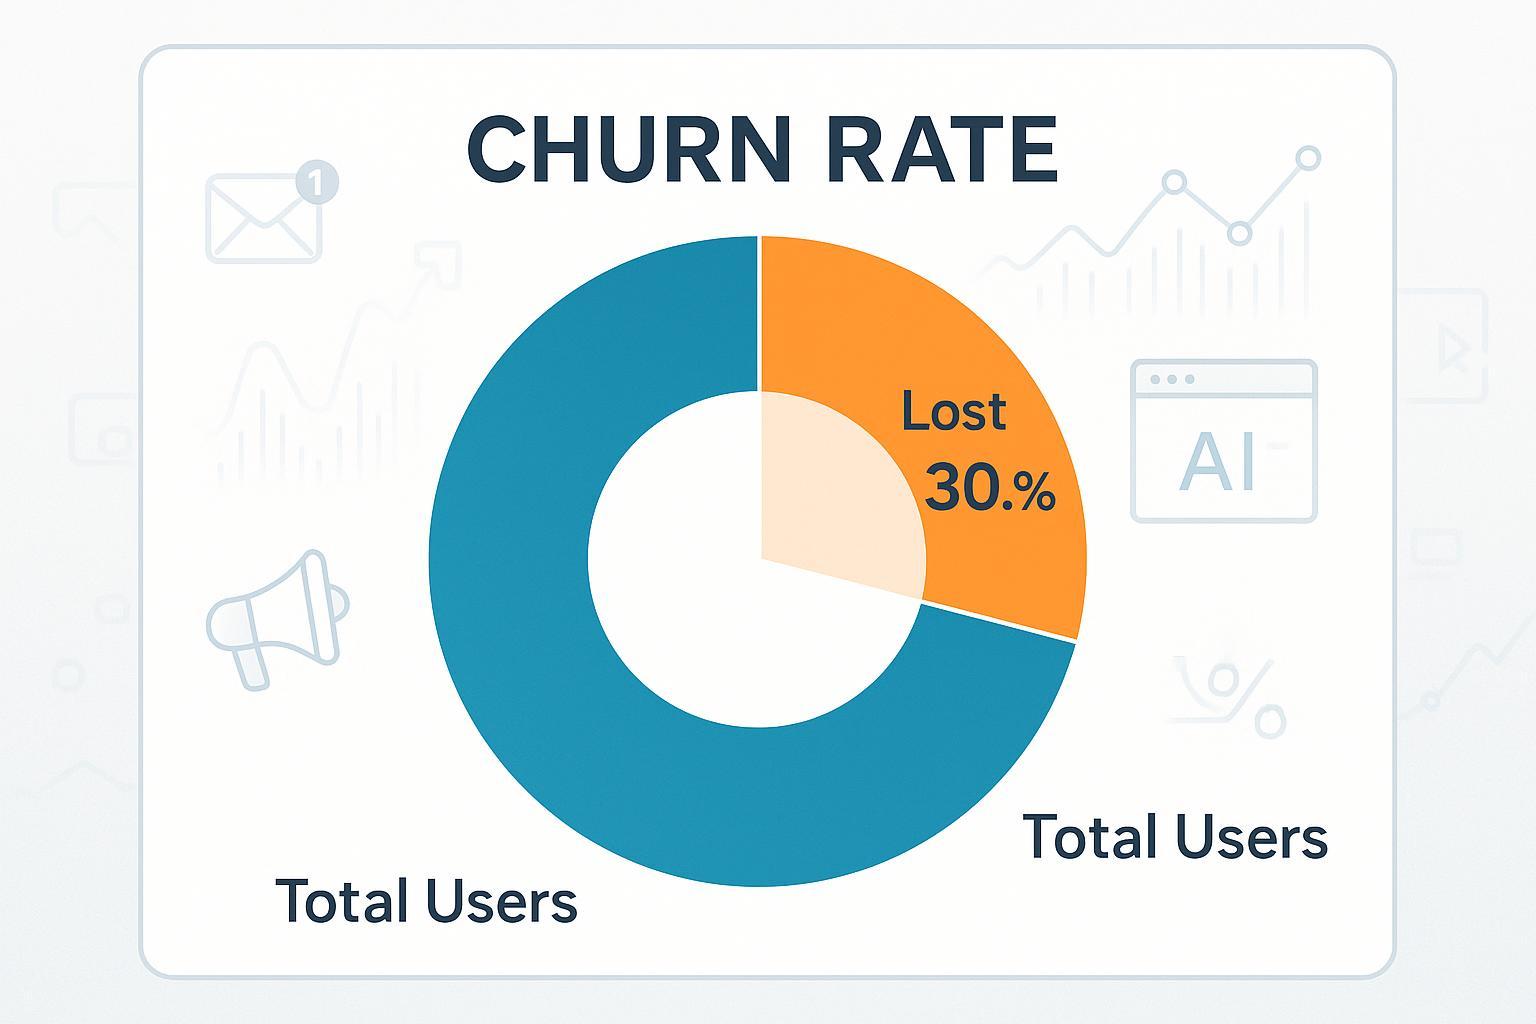
Visual Example – Churn Pie Chart:
Imagine your SaaS company begins a month with 1,000 subscribers and loses 30 by month-end. Your monthly customer churn rate is 3% (30/1,000 × 100).
- For revenue churn, if you lose $2,000 out of $50,000 monthly recurring revenue, your revenue churn rate is 4% ($2,000/$50,000 × 100).
Segmenting churn by channel, customer type, or behavior enables actionable insights for marketers and brand managers.
Real-World Application: AI-Powered Churn Reduction
In advanced digital marketing, AI and predictive analytics transform churn analysis. Brands use machine learning to identify at-risk customers by modeling engagement, feedback, and sentiment signals. For example, Netflix personalizes content to reduce churn using behavioral AI, while telecom leaders like T-Mobile leverage real-time analytics to proactively retain subscribers. These approaches detect early warning signs—such as declining activity or negative social mentions—and power automated retention campaigns.
Best practices recommend:
- Tracking both customer and revenue churn, segmented by cohort
- Using AI tools for real-time churn prediction and targeted intervention
- Integrating churn data with retention, acquisition, and lifetime value metrics
Related Concepts
- Retention Rate: The percentage of customers retained; the inverse of churn rate.
- Customer Lifetime Value (CLV): The total revenue expected from a customer; CLV drops as churn increases.
- Net Promoter Score (NPS): Indirectly linked to churn; lower NPS often signals higher churn risk.
- Revenue Churn: Monetary focus, contrasting with customer count.
- Attrition Rate: Another term for churn, sometimes used in HR or education contexts.
Explore more: Investopedia – Churn Rate Explained
Summary Table: Churn and Related Metrics
| Metric | What it Measures | Formula Example |
|---|---|---|
| Churn Rate | % of customers or revenue lost | (Customers Lost ÷ Start Customers) × 100 |
| Retention Rate | % of customers retained | (End Customers ÷ Start Customers) × 100 |
| CLV | Revenue per customer, lifetime | Avg. Value × Avg. Lifespan × Margin |
| NPS | Loyalty/advocacy measure | % Promoters − % Detractors |
| Revenue Churn | % recurring revenue lost | (Lost Revenue ÷ Start Revenue) × 100 |
Understanding churn rate is essential for digital marketing and brand management. It empowers teams to pinpoint risk, benchmark performance, and drive long-term growth—especially in the age of AI-powered analytics.


