
What is Bounce Rate? Definition, Calculation & Business Impact
Bounce rate explained: definition, calculation in UA & GA4, relevance for digital marketing, industry benchmarks, and tips for website engagement.
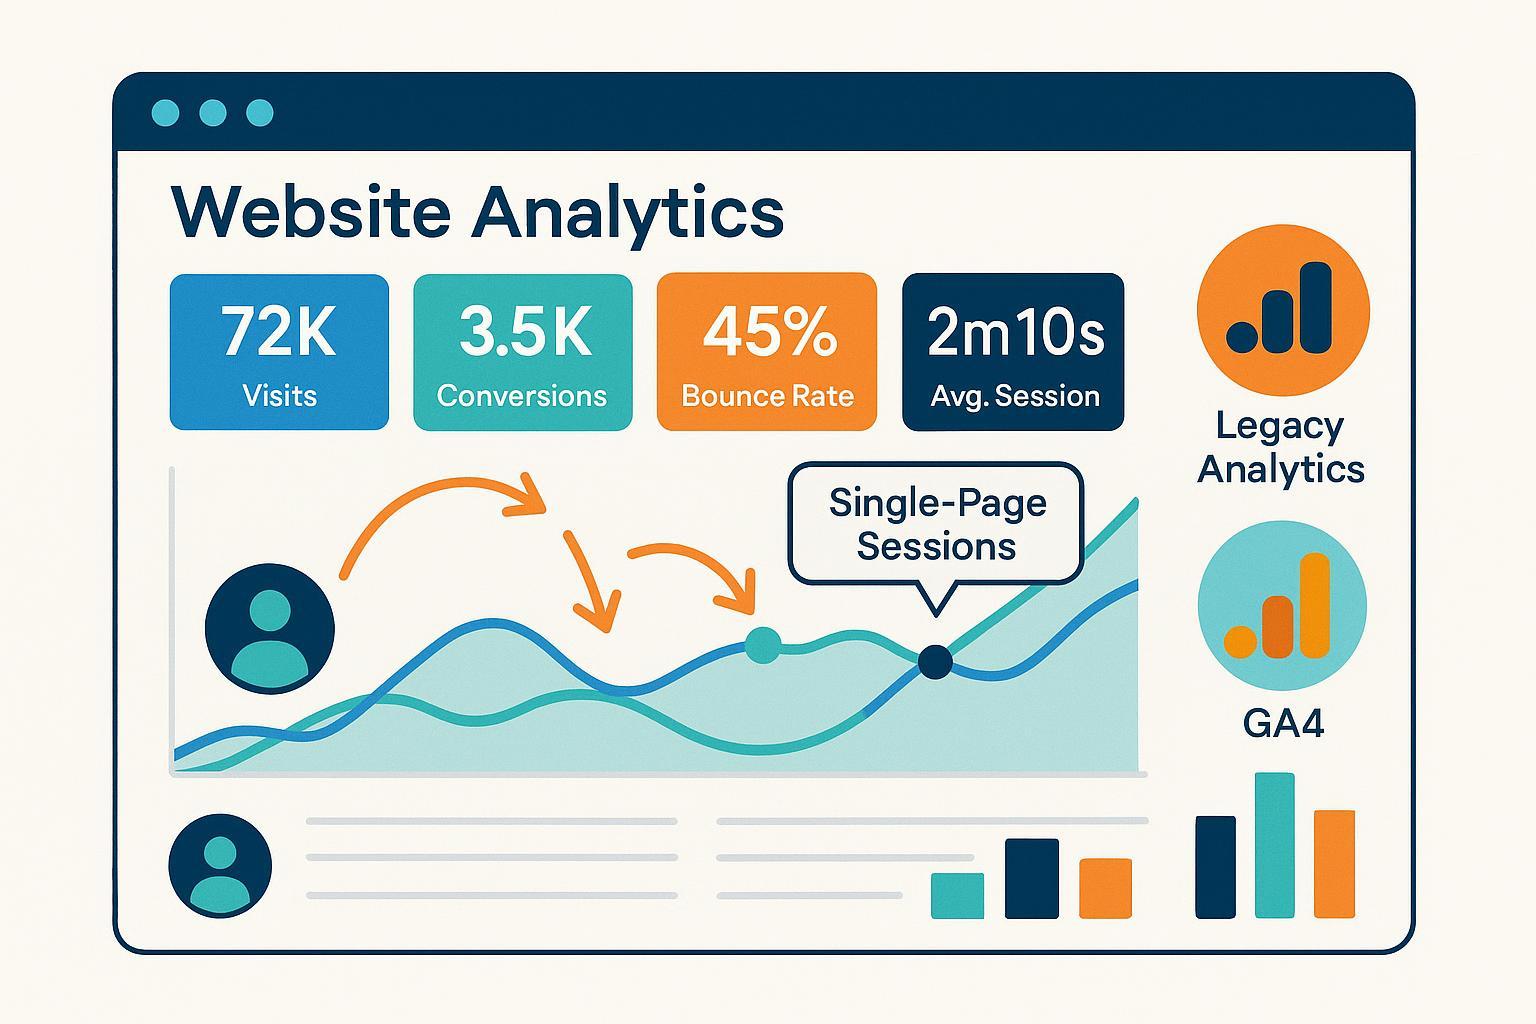
Bounce rate is the percentage of sessions where a user visits only one page or leaves a website quickly without engaging further—a key metric for measuring site engagement and identifying potential issues in content or user experience.
Detailed Explanation: Bounce Rate Across Analytics Platforms
In Universal Analytics (UA), bounce rate represents the proportion of all sessions on your site where users only viewed a single page and triggered no additional requests.
- Formula (UA):
(Single-Page Sessions ÷ Total Sessions) × 100%
In Google Analytics 4 (GA4), bounce rate is redefined as the percentage of sessions that are not engaged. GA4 considers a session engaged if it lasts more than 10 seconds, involves two or more page views, or triggers a conversion event.
- Formula (GA4):
(Non-Engaged Sessions ÷ Total Sessions) × 100% - Source: Google Analytics Support (link unavailable)
Both versions help marketers identify where audiences might lose interest and leave—crucial for improving conversion rates and content quality.
Key Components
- Session: A group of user interactions within a specific timeframe (like visiting pages or clicking links).
- Page View: Every time a user loads a page—core to understanding single-page sessions.
- Conversion Event: User actions valuable to business goals (e.g., purchases, signups).
- Engagement Rate: The inverse of bounce rate in GA4, showing sessions with real interaction.
Bounce Rate Benchmarks by Industry (2024)
| Website Type | Typical Bounce Rate |
|---|---|
| Content/Blog | 65% – 90% |
| Ecommerce | 20% – 45% |
| B2B/Service | 30% – 55% |
| Landing Pages | 70% – 90% |
| News/Media | 55% – 75% |
Note: These ranges vary by source and intent. Single-purpose pages often see higher bounce rates.
Real-World Examples & Case Insights
- Ecommerce: After improving mobile speed, a retailer lowered bounce rate by 77% and saw a jump in sales (case source).
- Retail Beauty: Social proof messaging dropped bounce rate 38% for NYX Professional Makeup (source).
- Publishing: Cutting bounce rate by 10% led to an extra 100,000 engaged sessions monthly for one media brand (source).
Bounce Rate vs. Exit Rate: Know the Difference
| Metric | What It Measures |
|---|---|
| Bounce Rate | % of sessions with only a single-page view |
| Exit Rate | % of sessions ending on a specific page (regardless of how many pages viewed previously) |
| Engagement Rate (GA4) | % of sessions meeting engagement criteria (lasts >10s, 2+ pages, or conversion) |
| Conversion Rate | % of sessions completing a desired action |
All bounces are exits, but not all exits are bounces.
Why Bounce Rate Matters
A high bounce rate can indicate:
- Content or offers that don’t match user intent
- Poor user experience or slow load times
- Unclear call-to-action or confusing layout
However, a high bounce rate isn’t always negative: For single-purpose landing pages (registration, download, info-only), one-page visits may signal successful goal completion. Focus on context and use complementary KPIs like engagement and conversion rates for a full picture.
Related Concepts
- Session: Basic user activity units. (Link unavailable)
- Page View: Basic user activity units. (Link unavailable)
- Exit Rate: Percentage of users leaving from a page (regardless of prior activity). (Link unavailable)
- Conversion Rate: Percentage of users taking a desired action. (Link unavailable)
- Engagement Rate (GA4): Sessions with significant interaction. (Link unavailable)
For a comprehensive understanding of digital marketing metrics, consider reviewing Google's Analytics Support (link unavailable) and industry benchmarks.