
Measuring share of voice in AI search: new metrics to benchmark your brand (2025)
Discover 2025's best practices for measuring AI search share of voice. Learn new KPIs, benchmarking methods, and how tools like Geneo enable cross-platform brand monitoring.
If your brand’s visibility plan still stops at blue links and social mentions, you’re missing where consideration increasingly forms: AI-generated answers. In 2025, AI Overviews and assistant-style responses compress the journey, summarize options, and influence what people believe is “true” about your product. The questions I hear most from brand and SEO leaders are: How do we quantify our presence in AI answers? How do we benchmark against competitors? And how do we move those numbers?
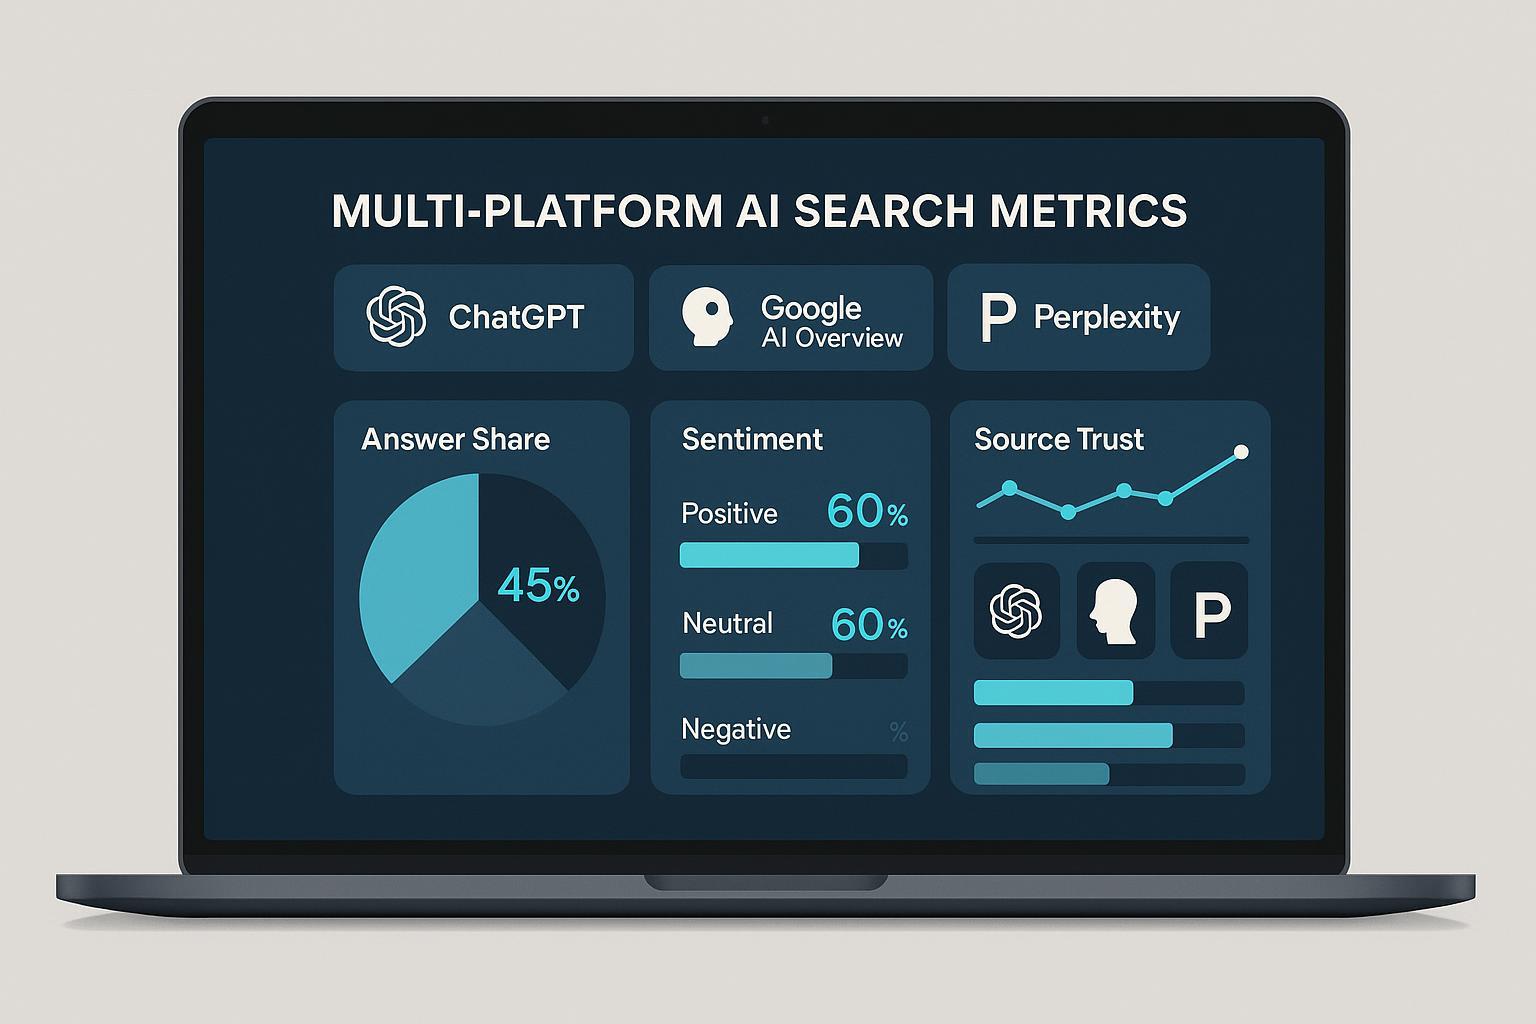
This guide distills a practice-first framework I’ve used with brand teams to measure and improve Share of Voice (SOV) across ChatGPT, Google AI Overview/AI Mode, Perplexity, and other assistants. It formalizes five 2025-native KPIs, shows exactly how to calculate them, and outlines a workflow you can run weekly with minimal friction.
Why now: AI search features are no longer fringe. In a March 2025 analysis of 400k+ searches, AI Overviews appeared on about 13.14% of queries, with ~5 linked sources per Overview (Semrush 2025). Multiple cohort studies in 2024–2025 observed material click shifts when Overviews show; for instance, reports summarized by Search Engine Land in 2025 on CTR impact document double-digit declines for top organic results when AI answers are present. Meanwhile, Google’s leadership has argued these surfaces drive “higher quality clicks” (Search Engine Land, 2025), underscoring that the game has changed: influence is moving inside the answer.
What’s different from classic SEO SOV: instead of rank and share of impressions, AI SOV is about being cited, being described accurately, and being framed positively inside generated answers. That means new, AI-native metrics.
The 2025 KPI set for AI Share of Voice
Below are the five metrics I recommend operationalizing. Each is designed to be trackable across platforms and to map to levers you control.
- AI Answer Share (AAS)
- Definition: The percentage of representative queries for which your brand or domain is cited or featured as a source inside the AI-generated answer on a given platform.
- Formula: AAS = (# prompts in which your brand/domain is cited) / (total prompts in segment) × 100.
- Why it matters: It’s the clearest proxy for “presence inside the answer.” 2025 guidance shifts toward AI-native attribution metrics like Attribution Rate and AI Citation Count (Search Engine Land 2025 KPIs).
- Nuance: Platform behaviors differ; Google AI Mode typically shows linked sources by default, while ChatGPT mixes explicit links with sourced statements depending on context, per OpenAI’s 2025 product updates.
- Citation Sentiment Score (CSS)
- Definition: The aggregate sentiment of the sentences or passages in AI answers that reference your brand.
- Method: Use aspect-based sentiment to score the polarity and strength of references (e.g., −2 to +2). Compute a weighted average by prominence in the answer. CX research in 2025 continues to show sentiment’s linkage to loyalty and wallet share, as reflected in Forrester’s 2025 Global CX Index. Treat CSS as a leading indicator and validate locally via brand-lift tests.
- Source Trust Differential (STD)
- Definition: The weighted trust gap between your brand’s cited sources and your competitors’ in AI answers.
- Method: Assign tiers (e.g., government/edu/peer-reviewed > tier-1 media/analyst > high-authority trade > niche blogs). Weight each citation accordingly and compute a differential vs. competitor set. This aligns with Google’s emphasis on helpful, experience-based content and quality signals (Google Developers, 2025) and broader trust patterns like the Edelman Trust Barometer 2025 orientation toward authoritative sources.
- Narrative Consistency Index (NCI)
- Definition: The stability of key brand facts and value props expressed across AI answers over time and platforms.
- Method: Maintain a canonical fact sheet (pricing, differentiators, integrations, availability). Each week, compare extracted claims from AI answers to canonical facts. Score 0–100 based on match rate and severity of deviations; flag drift. Platform guidance stresses transparency and helpfulness for AI features in Search, see Google’s AI features appearance docs (2025).
- Hallucination/Error Rate (HER)
- Definition: The percentage of answers mentioning your brand that include a factual error or unsupported claim.
- Method: Label answers against your fact sheet; compute HER = (# erroneous answers) / (# answers mentioning brand) × 100. Hallucination remains non-trivial in 2025; for example, peer-reviewed analyses show significant error/refusal trade-offs across models (e.g., the April 2025 HalluLens benchmark on LLM correctness). Use HER to prioritize remediation.
Optional extensions (useful, but secondary):
- Entity Co-Occurrence Map: Track which competitor or category entities co-appear with you in AI answers—are you grouped with leaders or long-tail alternatives? See 2025 studies on source overlap and assistant behavior like Ahrefs’ analysis of source overlap across assistants.
- Voice/Assistant Visibility: Track how often voice responses and assistant actions cite or recommend your brand; pair with structured data and conversational optimization per Search Engine Land’s measurement guidance (2025).
Measurement workflow you can run every week
This is the minimum viable process we use with brand teams. It’s designed to be replicable and statistically sound enough for directional decisions.
Step 1: Build a representative query set
- Include 200–500 prompts to start, stratified by intent (informational, commercial, navigational) and topic clusters. Mix “one-shot” and layered/follow-up prompts to mirror AI Mode’s conversational flow. This aligns with AI search behavior analyses such as SEMrush’s AI Mode research and sampling guidance (2025).
Step 2: Set sampling cadence and randomization
- Run weekly. Rotate sessions/accounts; vary geo/IP for your target markets; timestamp each run. This addresses personalization/localization noise, consistent with experimental approaches discussed in Search Engine Land’s 2025 AEO methodology articles.
Step 3: Collect answers and citations per platform
- Platforms differ: Google AI Mode typically lists sources; Perplexity includes explicit citations by default; ChatGPT provides citations variably, strengthened in professional/browsing contexts per OpenAI’s 2025 release cadence. Capture full text plus the source list.
Step 4: Label data
- For each answer, record: presence/absence of your brand; source domains; sentiment passages; key facts; competitor mentions; confidence cues (e.g., “may,” “typically”) to help identify uncertainty.
Step 5: Calculate the KPIs
- AI Answer Share by platform and intent segment
- Citation Sentiment Score (weighted by prominence)
- Source Trust Differential vs named competitors
- Narrative Consistency Index against your fact sheet
- Hallucination/Error Rate and error taxonomy (pricing, features, availability, governance)
Step 6: Triangulate with market impact
- Correlate weekly KPI movements with branded search, direct traffic, assisted conversions, and panel survey data where available. CX research like Forrester’s 2025 findings supports treating sentiment as an early signal while you validate locally.
Step 7: Report and prioritize
- Define thresholds (e.g., AAS < 20% on commercial queries is a priority; HER > 10% triggers remediation). Summarize actions by lever: content, PR, structured data, outreach, platform feedback.
Platform behaviors that influence measurement
Recognize how each engine handles attribution and conversation; design your measurement accordingly.
- Google AI Overview/AI Mode: Sources are usually shown and encouraged for exploration; multimodal reasoning and follow-ups are common. See Google’s AI features appearance documentation (2025). AI Overviews’ prevalence is rising, per Semrush’s March 2025 study on appearance rates and source counts.
- Perplexity: Citations are explicit and integral to the UX, making AAS measurement straightforward. Industry coverage consistently notes this transparency-first approach.
- ChatGPT: Citations occur, but visibility depends on mode and context; OpenAI’s updates have emphasized broader capabilities for browsing, multi-search, and agentic tasks, see OpenAI’s 2025 product announcements on agentic ChatGPT.
These differences mean your AAS and STD will not be comparable across platforms without context. Benchmark each platform separately and compare trends, not absolute levels.
Tooling that makes AI SOV measurable at scale
You can run the workflow manually, but it becomes tedious and error-prone. A dedicated monitor centralizes cross-platform data, tracks trends, and exposes sentiment and errors without extra scripts.
Where Geneo fits
- Cross-platform coverage: Monitor brand mentions and citations across ChatGPT, Google AI Overview/AI Mode, and Perplexity.
- Real-time tracking and alerts: See when your brand enters or drops from answers; get alerted to negative sentiment or errors.
- Sentiment analysis: Built-in analysis of passages referencing your brand to compute CSS over time.
- Historical query tracking: Store answer snapshots to compute NCI and investigate drift.
- Multi-brand benchmarking: Compare your AAS and STD vs competitors; roll up across portfolios.
- Content insights: Geneo suggests content and PR tactics based on observed gaps to improve SOV.
A practical example using Geneo
- Baseline: Import your 300–500-query set. Map platforms and segments (commercial vs informational). Geneo auto-collects answers weekly.
- KPI computation: Dashboards show AAS by platform and segment; CSS as a trendline with drilldowns; STD by trust tier; NCI vs your canonical fact sheet; HER with error categories.
- Prioritization: Filter to high-intent queries with low AAS or negative CSS. Export the cited source list to identify which publications you need to earn or improve.
- Remediation loop: Push tasks to content/PR teams. Re-run weekly to validate impact. Geneo’s multi-brand view ensures your gains outpace competitors.
Note: Other tools are emerging. For a broad market view of 2025 AI monitoring options, see reviews like Exploding Topics’ roundup of AI search monitoring tools (2025). Evaluate depth of platform coverage, sentiment, historical tracking, and alerting.
How to move the metrics (what actually works)
Here are interventions that consistently shift the KPIs in practice.
Move AI Answer Share (AAS)
- Earn citations from high-trust sources: Identify which domains appear most in AI answers for your category. Industry analyses show assistants draw from overlapping but distinct source sets; for context, see Ahrefs’ 2025 study on cross-assistant source overlap. Pursue digital PR, analyst coverage, and expert-contributed content on those domains.
- Strengthen topical authority: Publish expert, experience-backed guides aligned with E‑E‑A‑T signals and provide clear evidence. Google reiterates its quality stance in 2025 helpful content guidance.
- Optimize for retrieval: Use structured data, FAQ/HowTo schemas, and entity-rich content that aligns with how AI Mode chunks and synthesizes passages; this aligns with 2025 AEO/GEO recommendations like Search Engine Land’s focus on chunks/passages.
Improve Citation Sentiment Score (CSS)
- Address known objections: If AI answers surface drawbacks, publish evidence-based comparisons and customer stories addressing those concerns; seed third-party validations.
- Update stale or confusing product info: Inconsistent pricing or feature names drag sentiment down. Keep product pages and docs current and explicit.
- Capture proof signals: Ratings, certifications, security documentation, and analyst quotes.
Increase Source Trust Differential (STD)
- Target tier upgrades: If competitors are cited from .gov/.edu or tier-1 media and you are not, prioritize those placements. Use thought leadership and original data.
- Consolidate authority: Ensure your corporate site or docs are among cited sources for your own brand queries by maintaining comprehensive, well-structured pages.
Stabilize Narrative Consistency Index (NCI)
- Publish and maintain a canonical fact sheet: Pricing models, integration lists, SLAs, security compliance, availability by region.
- Create a change log: When facts change, update core pages and log the date; then track AI answers for drift for 2–4 weeks.
Reduce Hallucination/Error Rate (HER)
- Strengthen unambiguous facts: Use crisp product naming, unique identifiers, and plain-language FAQs.
- File feedback through platform mechanisms and community channels when errors persist; pair with on-site clarifications and third-party coverage.
- Recognize model variance: Benchmarks like the April 2025 HalluLens LLM evaluation show model families trade off error vs refusal. Prioritize monitoring where your audience actually searches.
Case-style walkthrough: from baseline to momentum (anonymized)
Here’s a composite process we’ve run with B2B SaaS brands. The emphasis is on decisions and workflow, not vanity metrics.
- Week 0: Build a 400-query set split evenly across informational and commercial intents. Configure U.S., U.K., and DACH sampling. Stand up Geneo with three competitor profiles and upload a canonical fact sheet.
- Week 1: Baseline shows modest AAS in AI Mode for informational queries; low AAS and mixed CSS for commercial prompts; HER flags a recurring feature misstatement.
- Decisions: Prioritize five buyer-intent clusters. Draft two evidence-led comparisons and a pricing explainer to address the misstatement. Pitch two analyst firms and three category media outlets that appear frequently in competitor citations.
- Week 3: Geneo trendlines show AAS up in informational segments, CSS improving where comparisons launched. AI Mode still sources competitors more often on commercial prompts.
- Decisions: Publish customer story with measurable outcomes; add structured data to comparison and pricing pages; expand FAQ to clarify deployment timeline.
- Week 5: AAS lifts on commercial prompts in Perplexity and AI Mode; STD narrows as first analyst mention lands; HER drops after updates propagate. Continue outreach toward tier-1 media.
- Ongoing: Quarterly, refresh the fact sheet, revisit entity coverage maps, and run cross-region tests. Tie KPI movements to assisted conversions and brand-lift surveys.
No silver bullets: We’ve had cycles where AAS plateaued until a top-tier domain cited our study, or where HER spiked after a rebrand. The key is rapid detection and focused remediation, not perfection.
Pitfalls, trade-offs, and governance
- Overfitting to one platform: Engines behave differently. Benchmark per platform instead of chasing a single blended score.
- Sampling bias: Small, static prompt sets lull you into false confidence. Rotate 10–20% of prompts each quarter to reflect language drift and new intents.
- Conflating correlation with causation: Treat CSS as a leading indicator. Validate with experiments (e.g., brand-lift surveys, PPC incrementality tests) before attributing revenue.
- Ignoring trust composition: Two brands can have similar AAS but very different STD. Higher-trust sources tend to stabilize NCI and reduce HER over time.
- Under-resourcing governance: Create a cross-functional working group (SEO/AEO, Content, PR, Legal/Comms, Product). Maintain a decision log and escalation path for high-severity hallucinations.
Reporting cadence and templates
- Weekly ops view: AAS, CSS, HER by platform and intent; top errors; top negative sentiments; actions in flight.
- Monthly exec view: Trendlines for AAS/CSS/STD/NCI; competitive deltas; wins (new high-trust citations); risks (narrative drift); correlation snapshots to demand metrics.
- Quarterly strategy: Rebuild the query set; reassess trust tiers; re-align with product roadmap; set outreach targets for specific domains that drive AAS in your category.
A simple scoring template
- Health score per platform (0–100): 35% AAS + 25% CSS + 20% STD + 15% NCI − 5% HER. Adjust weights to your category (e.g., medical or financial may weight STD and HER higher due to compliance).
Appendix: sampling and calculation specifics worth standardizing
- Query stratification: Target at least 30–50 prompts per major intent/topic cell to reduce variance.
- Geo: If you sell in multiple markets, treat each geo as its own platform for benchmarking purposes.
- Source mapping: Maintain a canonical list of high-trust domains for your category and update tiers quarterly, guided by quality criteria echoing Google’s essentials and E‑E‑A‑T framing (2025).
- Overviews context: Remember that AI Overviews are not universal. Use appearance rates like Semrush’s 2025 prevalence findings to set expectations by query class.
Implement this with Geneo in under an hour
Geneo is purpose-built for AI search visibility:
- Cross-platform brand monitoring across ChatGPT, Google AI Overview/AI Mode, and Perplexity
- Real-time citation tracking and alerts
- Built-in sentiment analysis to compute CSS
- Historical answer logs for NCI and HER auditing
- Multi-brand benchmarking and portfolio rollups
- Content and PR suggestions based on observed gaps
Get started: create your account at https://geneo.app, import your query set, and connect your brand and competitor profiles. Within a week, you’ll have baseline AAS/CSS/STD/NCI/HER, prioritized fixes, and a repeatable reporting cadence.
Key sources for further reading
- Appearance and impact of AI Overviews: Semrush’s March 2025 AI Overviews study and Search Engine Land’s 2025 CTR impact coverage
- AI-native KPIs for generative search: Search Engine Land’s 2025 KPI recommendations
- Google guidance on helpful content and AI features: Google Developers on creating helpful content (2025) and AI features appearance in Search
- Assistant behaviors and overlap: Ahrefs’ 2025 assistant source overlap analysis
- Model error considerations: HalluLens 2025 LLM correctness benchmark
- Sentiment linkage to outcomes: Forrester Global CX Index 2025
The bottom line: Treat AI answers as the new front page. Measure your presence, sentiment, and trust composition weekly. Close the loop with content, PR, and governance. And use a purpose-built monitor like Geneo to run the playbook consistently across platforms.