
What Is Engagement Rate? Engagement Rate Definition for Digital Marketing
Engagement Rate definition, key formulas, benchmarks, and its role in digital marketing metrics. Learn how to measure and interpret audience engagement.
One-Sentence Definition
Engagement Rate is a percentage-based metric that quantifies how actively your audience interacts with your brand content on digital platforms, measured relative to your audience size or content reach.
Detailed Explanation
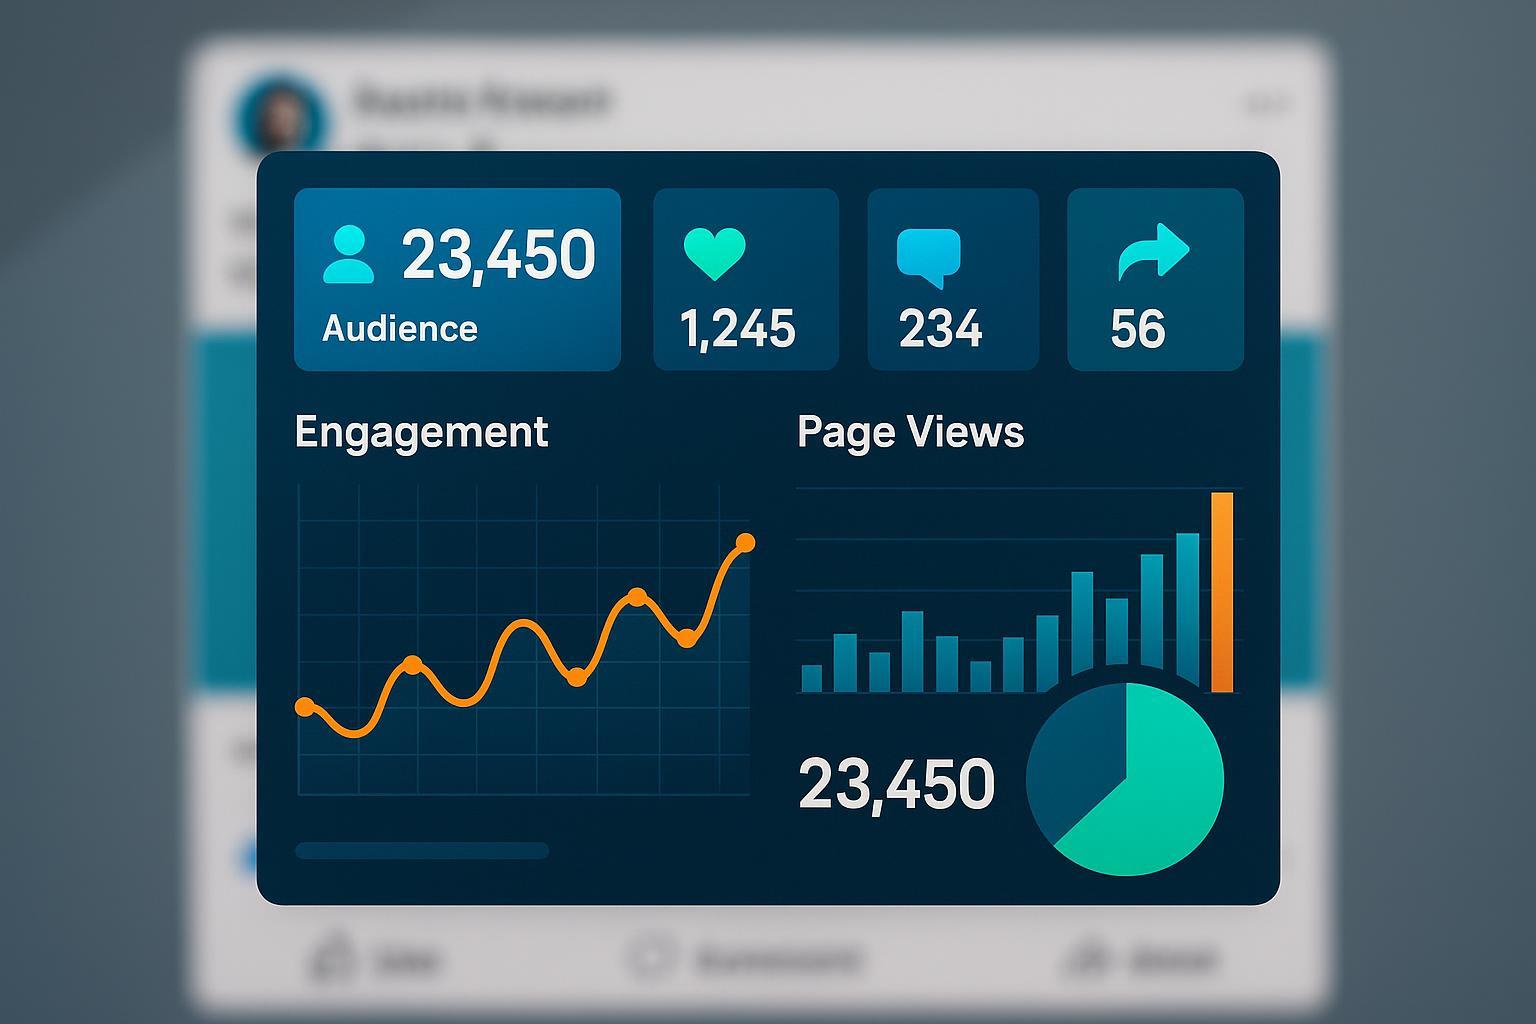
Engagement Rate stands as one of the most important KPIs in digital marketing and brand analytics. This metric aggregates meaningful user actions—such as likes, comments, shares, saves, and clicks—expressing them as a proportion of your potential audience. Unlike pure exposure metrics, Engagement Rate captures depth and quality of interaction, helping marketers assess how well content resonates.
According to AgencyAnalytics and Sprout Social, Engagement Rate illuminates not just who saw your content, but who found it interesting enough to act—enabling brands to optimize for true connection, not just visibility.
Key Components & Formula Breakdown
Engagement Rate can be calculated differently across platforms. Here is a common formula and a comparison by channel:
| Platform | Typical Formula | What Counts as Engagement |
|---|---|---|
| (Total Engagements / Total Reach) × 100 | Likes, comments, shares, clicks | |
| (Total Engagements / Followers) × 100 | Likes, comments, shares, saves | |
| (Total Engagements / Impressions) × 100 | Likes, comments, shares, clicks | |
| X (Twitter) | (Total Engagements / Impressions) × 100 | Likes, retweets, replies, link clicks |
| TikTok | (Total Engagements / Views or Followers) × 100 | Likes, comments, shares |
Formula Example:
Suppose your Instagram post receives 180 combined likes, comments, shares, and saves, and your account has 5,000 followers:
Engagement Rate = (180 / 5,000) × 100 = 3.6%
For Facebook, if a video receives 300 total engagements and reaches 8,000 users:
Engagement Rate = (300 / 8,000) × 100 = 3.75%
Practical Application & Benchmarks
Brands and marketers use Engagement Rate to gauge campaign resonance, inform creative strategy, and track performance shifts. For example, a steady increase in a brand’s Engagement Rate during a product launch signals effective content and deeper audience connection.
Typical Benchmarks:
- Instagram: 1-5% is considered healthy, 3%+ is strong (mid/late 2020s averages).
- Facebook: 0.5-1% is common due to wider reach and algorithmic feed limits.
- LinkedIn: 2%+ is strong for company pages. Benchmarks vary by industry, follower base, and content type. Always compare against similar accounts for context.
Limitations & Best Practices
- Platform Differences: Each social channel measures Engagement Rate with slightly different denominators and qualifying actions.
- Bot/Fraud Risk: Fake accounts and automated activity can inflate rates.
- Paid vs. Organic: Segregate data to benchmark organic performance accurately.
For robust interpretation, combine Engagement Rate insights with reach, impressions, and conversion data for a complete performance picture.
Related Concepts & Key Differences
- Reach: Number of unique users who see your content.
- Impressions: Total times content is displayed (can include repeats).
- Click-through Rate (CTR): Percentage of impressions resulting in clicks—a more action-specific metric.
- Conversion Rate: Percentage of users who complete a desired action (purchase, signup) after engaging.
How Engagement Rate Differs: Engagement Rate measures the quality and depth of audience interaction, whereas reach and impressions capture only potential and total exposure.
Further Resources
- In-depth KPI Definition – AgencyAnalytics
- Sprout Social Engagement Rate Glossary
- Hootsuite’s Guide to Engagement Rate
Engagement Rate remains a cornerstone metric for any marketer or brand manager seeking to build not just a visible, but an actively connected digital audience.