
What Metrics Should Agencies Track to Prove ROI from AI Search
Discover essential metrics agencies must track to prove ROI from AI search. Learn advanced reporting, visibility KPIs, attribution, and executive dashboards.
AI answer engines are reshaping how people research, compare, and decide. Zero‑click behaviors keep growing, and referral traffic from AI platforms remains small—roughly around 1% across major industries, with most of that coming from ChatGPT, according to coverage in Search Engine Land (Nov 2025). If your reporting still leans on rank and sessions alone, you’ll miss where influence is actually happening.
This best‑practice guide outlines the metrics and workflows agencies can standardize to prove ROI from AI search—spanning visibility, influence, sentiment, and efficiency—plus how to package results in executive dashboards and QBRs.
1) Visibility KPIs that predict ROI
Start by quantifying whether your clients show up in AI answers at all and how prominently. These upper‑funnel signals correlate with downstream demand, even when clicks are scarce.
-
AI Share of Voice (AI‑SOV): Proportion of AI answers that mention or recommend your brand versus a defined competitive set, across a controlled prompt library and engines. A position‑weighted approach is more informative:
- Formula: sum(position_weight × brand_appearance) ÷ sum(position_weight × any_brand_appearance), normalized to 0–100.
- Position weights example: top pick=3, list item=1, supporting reference=0.5.
-
Appearance Rate in AI Overviews/AI Answers: The percentage of test prompts where the brand appears within the generated answer.
- Formula: brand_appearances ÷ total_prompts × 100.
-
AI Mentions and Total Citations: Count every brand reference and every explicit citation/link by engine, topic, and locale. Distinguish correct vs. misattributed links and store timestamps and snapshots for auditability.
-
Recommendation Type and Prominence: Classify each mention’s prominence using a weighting scheme (e.g., top pick vs. list item) and multiply by frequency to quantify prominence.
-
Entity Coverage and Model Coverage: Confirm the brand is recognized consistently across ChatGPT, Perplexity, and Google AI Overviews (and their model updates) and across target locales.
Why these matter: As AI answers become the “front door” to research, visibility metrics tell you whether the brand is present during consideration. Think of it like shelf space in a grocery store—if you’re not on the shelf, you don’t get picked.
For deeper context on AI visibility measurement practices and answer‑first optimization, see the AI Visibility Ultimate Guide for Marketing Agencies.
2) Influence and attribution metrics when clicks are scarce
Proving ROI means tying visibility to outcomes. With limited direct referrals, blend bottom‑up analytics with top‑down lift modeling.
-
Assisted Conversions from AI‑Originating Sessions: Use GA4’s data‑driven attribution (DDA) to identify conversions where an AI engine referral started the journey, even if it wasn’t the last click. Tag and segment sources/mediums associated with AI engines; validate with controlled tests.
-
Branded Search Lift Post‑Exposure: Measure incremental increases in branded queries after exposure in AI answers. Set up geo/time lift tests: compare exposed regions or periods (higher AI Overviews presence) vs. controls.
-
Conversation‑to‑Click Rate (AI Engines): When AI answers do include links, track the percentage that leads to a site click. Industry coverage suggests referrals are small—contextualize with the above SEL finding and related signals.
-
Lead Quality Delta (AI vs. Organic Search Cohorts): Compare conversion rates and downstream quality (SQL rate, pipeline value per lead, CAC/LTV) for cohorts that originate via AI referrals versus traditional search.
Measurement methods to make these credible:
-
Incrementality Testing: Isolate uplift by geography or timeframe when AI answers feature your client more often. Search Engine Land’s 2025 guidance highlights broader zero‑click movement; your tests quantify client‑specific impact.
-
MMM with an AI Visibility Signal: Add AI‑SOV, appearance rate, or mentions as upper‑funnel variables. While industry bodies haven’t issued AI‑specific MMM standards, you can follow general practice and include visibility as a covariate.
-
GA4 Cohorts and DDA: Separate AI‑originating sessions, track assisted conversions, and observe lag windows (7/14/28 days).
-
Qualitative Triangulation: Capture sales notes, support tickets, PR mentions, and on‑platform feedback (“thumbs up/down”) that reference AI answers. When clicks are missing, these signals help tie influence to outcomes.
For an executive framing of GEO/AI KPIs that blend visibility with outcomes, see Executive KPIs for GEO.
3) Sentiment, accuracy, and brand safety
Showing up is necessary; showing up correctly and positively is non‑negotiable.
-
Net Sentiment: Classify mentions as positive/neutral/negative; compute Net Sentiment = positive rate − negative rate. Include trendlines in monthly rollups.
-
Accuracy/Misattribution Rate: Track the frequency of incorrect facts or wrong links associated with the brand, and measure time‑to‑mitigation for fixes.
-
Governance: Maintain a prompt library with versioning, note engine/model updates, and store answer snapshots for audits. This protects against back‑and‑forth changes that can invalidate comparisons.
4) Efficiency and cost metrics
ROI isn’t only about revenue; efficiency gains from automation also matter, particularly in reporting and content workflows.
-
Cost per AI Mention/Citation: Total program cost ÷ total mentions/citations across engines.
-
Reporting Time Saved: Hours saved by automated monitoring vs. manual spot‑checks, monetized using your blended billable rate.
-
Content Production Efficiency: Track time or cost reductions enabled by AI‑assisted processes. McKinsey’s 2024–2025 coverage shows material efficiency signals across marketing and retail use cases; use ranges to contextualize expectations, not promises. For example, see McKinsey’s State of AI 2024.
5) Dashboards and cadence: operationalizing measurement
You’ll convince executives with structured, repeatable reporting more than with one‑off screenshots. Establish a clear cadence, then standardize dashboard sections.
Cadence recommendations:
- Weekly operational snapshots: AI‑SOV, mentions/citations, sentiment changes.
- Monthly rollups: Visibility trends, assisted conversions/cohorts, branded search lift.
- Quarterly business reviews (QBRs): Executive scorecard covering visibility, influence, accuracy, and efficiency.
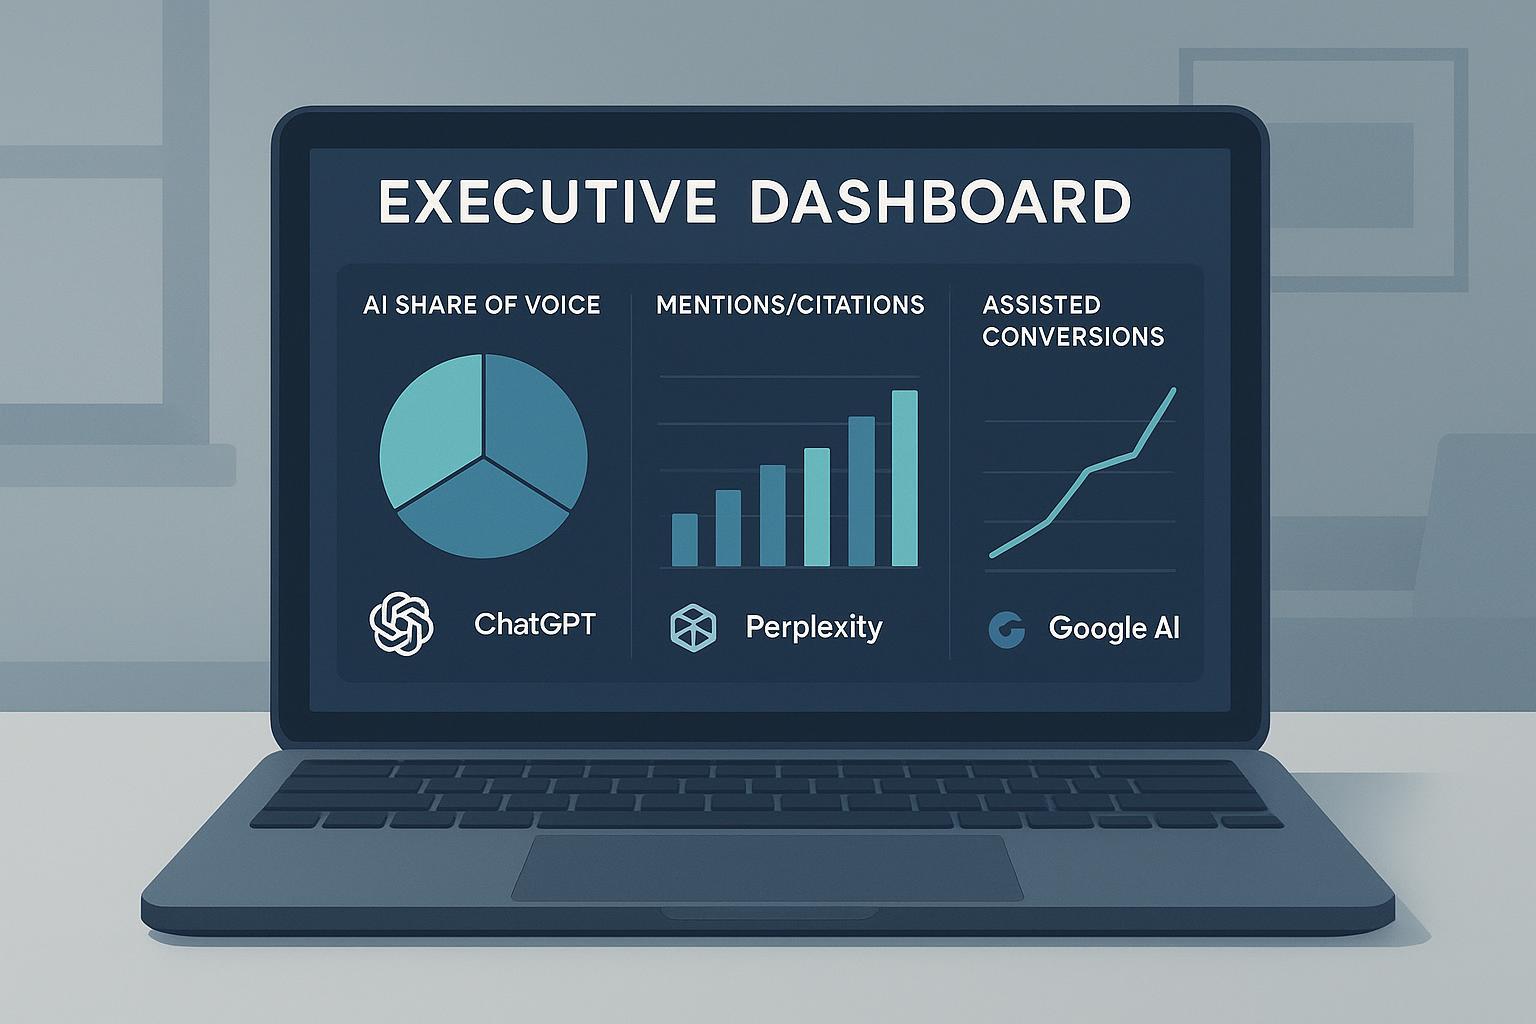
Suggested dashboard sections:
- Visibility Overview: AI‑SOV, appearance rate, total mentions/citations; platform breakdown (ChatGPT, Perplexity, Google AI Overviews). Coverage of AI visibility indices by industry publishers demonstrates the volatility and value of tracking these signals; see Search Engine Land’s AI Visibility Index reporting (late 2025) for methodology patterns.
- Sentiment & Accuracy: Net sentiment trend, misattribution rate, time‑to‑mitigation.
- Influence & Outcomes: Branded search lift, assisted conversions/cohorts, MMM contribution where feasible.
- Efficiency: Reporting time saved, content production efficiency ranges.
Disclosure: Geneo (Agency) is our product.
Example implementation note: When agencies need multi‑engine monitoring and white‑label client portals to present AI‑SOV, mentions/citations, and platform breakdowns, a tool like Geneo (Agency) can centralize tracking and export dynamic dashboards without manual screenshots. Use any platform that supports custom domains, branding, and daily history to make QBRs auditable.
For answer‑first optimization and measurement setup that feeds these dashboards, the AEO Best Practices 2025 guide outlines stepwise content and schema upgrades that increase citation likelihood.
6) Implementation checklist
Use this compact checklist to stand up AI search ROI measurement in under four weeks.
- Define scope: Prompt library by intent and locale; competitor set; engines to track (ChatGPT, Perplexity, Google AIO).
- Instrumentation: Tag AI referrals in GA4; set up cohort tables and assisted conversion tracking; configure branded search monitoring.
- Baselines: Record AI‑SOV, appearance rate, mentions/citations, net sentiment, misattribution rate.
- Tests: Launch geo/time lift tests; design MMM with visibility variables; set 7/14/28‑day lag windows for cohort analysis.
- Reporting: Build dashboards with the four sections above; establish weekly/monthly/QBR cadence; store answer snapshots for audits.
- Governance: Log engine/model changes, prompt versioning, and mitigation workflows.
7) 2025 benchmark snapshot
Below is a high‑level snapshot you can use to contextualize expectations in executive conversations. Ranges vary by industry and query intent.
| Signal | 2024–2025 benchmark/observation | Source |
|---|---|---|
| Zero‑click share | US ≈58.5% (2024 study); monthly 2025 US measure ≈27.2% (method differs) | SparkToro 2024 zero‑click study; SEL June 2025 |
| AIO prevalence & impact | AIO visible on ≈9–16% of keywords; position‑1 CTR down ≈34.5%; organic CTR drop 61% on info queries with AIO; zero‑click ≈80–83% when AIO appears | Ahrefs, Apr–May 2025; SEL Nov 2025; Similarweb May 2025 |
| AI referrals share | ≈1% of total visits on average across major industries; >90% from ChatGPT; Perplexity growing from a small base | SEL Nov 2025 |
| Traffic shift forecast | Traditional search volume to drop ≈25% by 2026 | Gartner projection via SEL coverage, 2024–2025 |
| Efficiency signals | Marketing/sales workflows show meaningful time savings and performance lifts in case coverage | McKinsey State of AI 2024 |
Use these as directional anchors, not guarantees. Methodologies differ, and sector dynamics are uneven.
8) Next steps for agencies
Here’s the deal: the reporting surface has changed, but the executive questions haven’t. Can you show that visibility is improving, that influence is rising, and that the program is more efficient?
- Prioritize visibility signals (AI‑SOV, appearance rate, mentions/citations) and pair them with influence metrics (assisted conversions, branded search lift) in your executive scorecards.
- Expand governance to include sentiment and accuracy tracking—brand safety matters as much as presence.
- Bake efficiency into ROI: quantify reporting automation and content production time saved.
If you need a ready‑to‑use, white‑label way to present these metrics across ChatGPT, Perplexity, and Google AI Overviews, platforms like Geneo (Agency) can help standardize dashboards and client portals. Keep the setup auditable, and iterate monthly based on answer volatility.
Open question to take into your next QBR: Which two visibility levers—entity coverage or citation frequency—would move the needle fastest for your largest client, and how will you measure that shift over 90 days?