
AI Search Visibility Score: What It Is & How It's Calculated
Learn what an AI search visibility score means, how it's calculated, and why it matters for measuring citations and brand presence in generative search.
What an AI Search Visibility Score Measures (and how it differs from rankings)
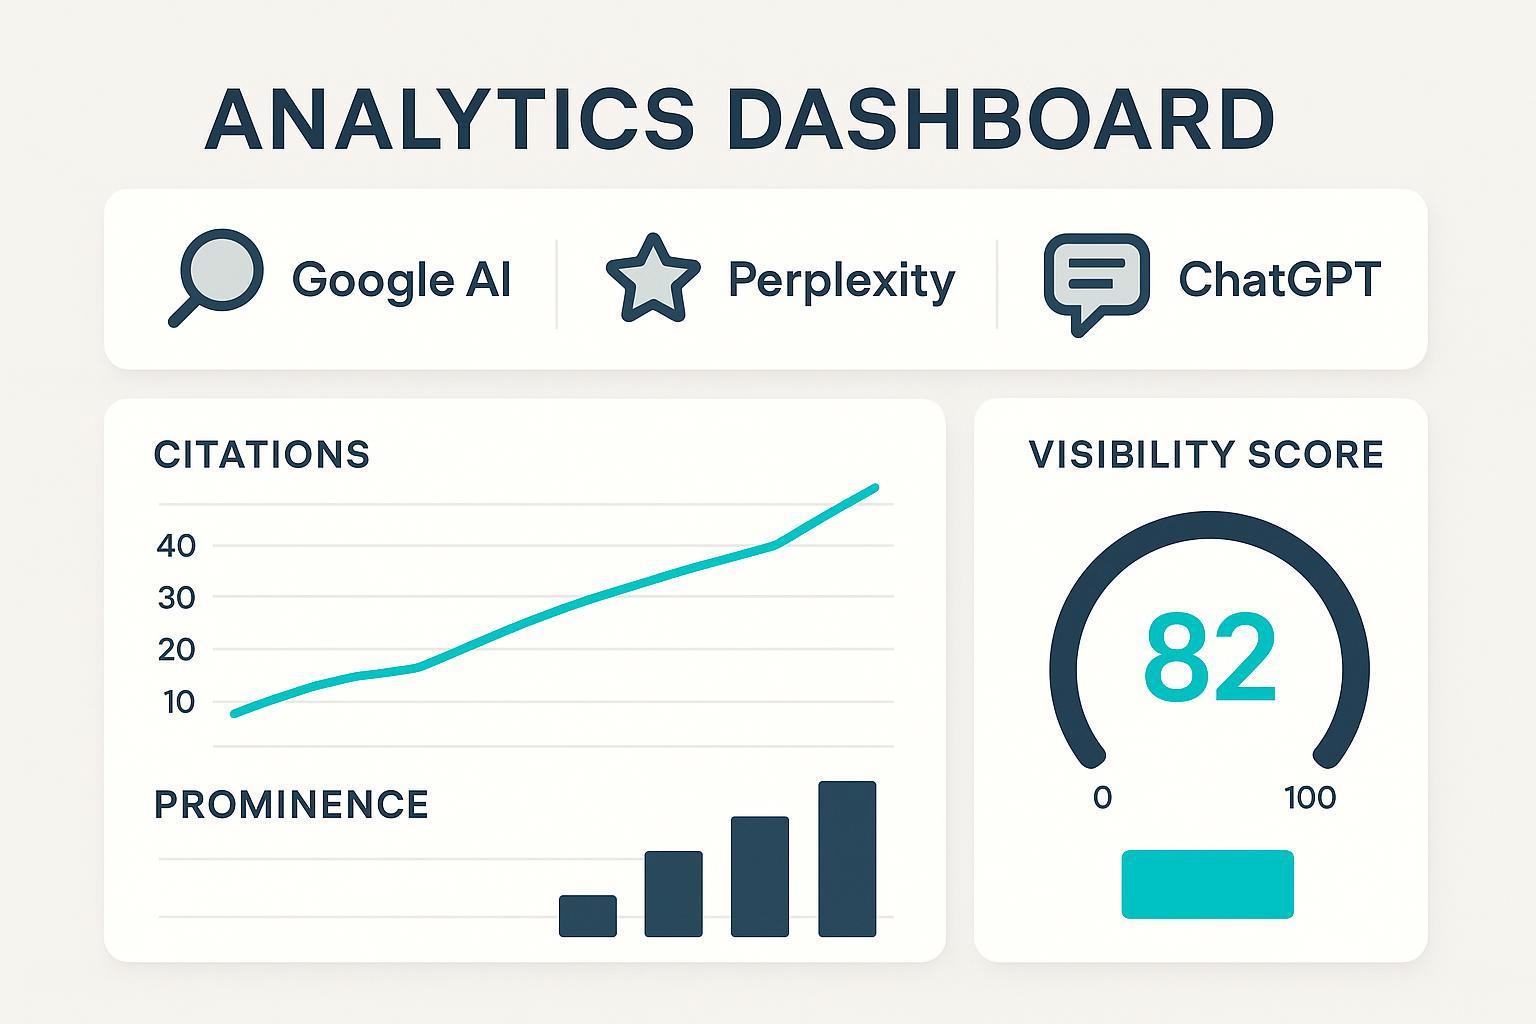
An AI search visibility score tells you how often—and how prominently—your brand or domain appears inside generative answers across engines like Google’s AI Overviews/AI Mode, Perplexity, and ChatGPT when Search/Deep Research is enabled. Think of it as your brand’s share of voice inside the answer itself, not just on a list of blue links.
This differs from traditional SEO visibility. Classic visibility metrics weight ranking positions by expected click-through rate (CTR) across a keyword set, as documented in systems such as the Semrush visibility percentage, which relies on CTR-weighted positions across tracked keywords, and the SISTRIX Visibility Index, an absolute value index built on representative keywords and click probability models. See Semrush’s explanation of position-tracking visibility and CTR weighting in their knowledge base, and SISTRIX’s description of its index methodology emphasizing click probability in the official tutorials: Semrush Position Tracking visibility (KB) and SISTRIX: What is the Visibility Index?.
In AI search, the mechanics shift. You’re scored on being cited, mentioned, or recommended inside the AI module; where that reference appears; and the relative likelihood a user will click from that placement. That’s why any sound calculation must blend presence, prominence, and expected clicks—then aggregate across engines.
If you want a glossary for the surrounding terms (GEO/GSO/LLMO and friends) to ground the vocabulary, see our explainer: AI SEO acronyms explained (GEO, GSO/GSV, AIO, LLMO).
Inputs You Need Before You Calculate
Before you touch a spreadsheet, decide on a stable, intent-balanced prompt set (informational, commercial, transactional, and local). Keep it fixed for a month so you can compare apples to apples, then revisit quarterly.
Collect results from three primary surfaces:
- Google AI Overviews/AI Mode (where available)
- Perplexity (live retrieval with inline citations)
- ChatGPT with Search or Deep Research turned on
For each prompt on each engine, capture the answer exactly as shown. You’ll need to detect:
- Whether your brand/domain is present (cited link, named brand, or product mention)
- Placement and format (top link cluster, expandable card, inline list, recommendation wording)
- A conservative expected click proxy for that placement
- The sentiment of the surrounding passage (positive, neutral, or negative)
Why expected clicks? Established visibility models in SEO weight positions by the likelihood of getting clicked; you should do the same in AI contexts, using relative, documented assumptions rather than arbitrary scores. For background on CTR-weighted visibility, see Semrush’s visibility documentation and SISTRIX’s handbook on the Visibility Index.
For sentiment, use a simple three-class rubric. Keep the adjustment modest so it informs, not overwhelms, the score. For a deeper discussion of measurement rubrics across LLM outputs, including sentiment monitoring, this guide helps: LLMO metrics: measuring accuracy, relevance, personalization.
Finally, practice data hygiene: deduplicate repeated citations within an answer, distinguish brand- vs. domain-level mentions, and timebox everything with screenshots. If you’re building out a broader KPI set for AI search (visibility, sentiment, and downstream conversion), this framework lays out the bigger picture: AI search KPI frameworks: visibility, sentiment, conversion.
The Calculation Framework: Step-by-Step with a Worked Example
Here’s the core idea, applied per prompt and then rolled up per engine:
- Per-prompt contribution on engine E
Contribution(p, E) = Presence × Prominence × ExpectedClicks
- Presence: 1 if you’re cited/mentioned; 0 if not. You can allow fractional values (e.g., 0.5) for indirect references.
- Prominence: a 0–1 factor that considers placement (top card vs. secondary section), number of mentions, and recommendation phrasing.
- ExpectedClicks: a platform-specific proxy tied to placement/format.
- Aggregate per engine across N prompts
V_E = (Σ Contribution(p, E)) / N
- Sentiment adjustment (three-class rubric)
Adjusted_V_E = V_E × (1 + s_E), where s_E ∈ [−0.2, +0.2]
- Cross-engine weighting
AI Search Visibility Score = Σ_E (w_E × Adjusted_V_E)
A few practical assumptions for 2025:
- Google AI Overviews/Mode: Assign higher expected click weights to the top link cluster than to expandable or secondary placements. Google confirms that traffic from AI features rolls into the Web search type in Search Console rather than a separate channel, per Google’s “AI features and your website” (2025).
- Perplexity: Citations are explicit and ordered; use a slightly higher expected click proxy for first-cluster citations. The product documents multi-source citation behavior in the Help Center: How Perplexity works.
- ChatGPT: Citations appear when Search or Deep Research is on; otherwise, you may see none. OpenAI notes when and how citations are included: ChatGPT Search and Deep Research FAQ.
Worked example (sample numbers) Assume 20 prompts across Google, Perplexity, and ChatGPT. Choose weights w_Google = 0.5, w_Perplexity = 0.3, w_ChatGPT = 0.2. Use conservative platform rubrics (illustrative):
- Google: Prominence 0.8 for top cluster, 0.5 for expandable, 0.3 for mention-only; ExpectedClicks 0.6, 0.3, 0.15 respectively.
- Perplexity: Prominence 0.7 first citation, 0.5 others; ExpectedClicks 0.5, 0.25.
- ChatGPT (Search): Prominence 0.6 first citations, 0.4 others; ExpectedClicks 0.4, 0.2.
Suppose your per-engine averages come out as:
- V_Google = 0.32; sentiment s_Google = +0.10 → Adjusted_V_Google = 0.352
- V_Perplexity = 0.28; sentiment s_Perplexity = 0.00 → Adjusted_V_Perplexity = 0.280
- V_ChatGPT = 0.18; sentiment s_ChatGPT = −0.10 → Adjusted_V_ChatGPT = 0.162
Now weight and sum: Score = 0.5×0.352 + 0.3×0.280 + 0.2×0.162 = 0.2924 → 29.2% (if you present as a percentage)
To see how we tally citations and mentions in real prompts, explore this example with captured answers and sources: Enterprise database disaster recovery planning — query report.
| Engine | V_E (avg) | Sentiment s_E | Adjusted_V_E | Weight w_E | Contribution |
|---|---|---|---|---|---|
| Google AI | 0.32 | +0.10 | 0.352 | 0.50 | 0.1760 |
| Perplexity | 0.28 | 0.00 | 0.280 | 0.30 | 0.0840 |
| ChatGPT | 0.18 | −0.10 | 0.162 | 0.20 | 0.0324 |
| Total | 0.2924 → 29.2% |
Guardrails that keep the math honest
- Document your rubric and keep it consistent month to month.
- Snapshot answers and store citation lists for audits.
- Keep the sentiment cap modest (±0.2) so visibility mechanics remain primary.
Workflow You Can Replicate (with one neutral Geneo example)
Here’s a straightforward monthly cadence you can run with a small prompt set first. Ready to try it? Let’s keep it simple and auditable.
- Fix your prompt set and timebox collection to a 48–72 hour window.
- Capture Google AI Overviews/Mode, Perplexity, and ChatGPT (Search/Deep Research) answers with screenshots and raw citations.
- Apply your presence, prominence, and expected click rubric per prompt per engine.
- Classify sentiment for the passage(s) mentioning your brand (positive/neutral/negative); record the rubric call.
- Calculate V_E, apply sentiment, and weight across engines to get the score.
- Compare against competitors on the same prompt set; annotate notable UI changes.
Disclosure: Geneo is our product. In this workflow, Geneo can be used to monitor cross-engine citations, capture answer snapshots with timestamps, and apply a consistent sentiment rubric across passages. It also supports multi-brand comparisons so you can chart trends over time. We recommend keeping your rubric definitions inside your documentation or a shared workspace, regardless of the tool you use.
Platform Nuances, Limits, and Reporting
-
Google AI Overviews/AI Mode: Google explains that links help users “explore more” and that traffic from AI features is counted under the Web search type in Search Console, not broken out separately. See Google’s “AI features and your website” (2025) for the most current guidance. This means you can’t isolate AI-only clicks in Search Console today, so your visibility score is especially useful for directional tracking.
-
Perplexity: Answers typically include multiple, explicit citations with clickable source links. The Help Center outlines how multi-source retrieval works: How does Perplexity work?. Because citations are clear, your prominence rubric can safely emphasize citation order and section placement.
-
ChatGPT: Citations require Search or Deep Research; otherwise you may get narrative text without links. OpenAI’s docs detail when citations appear: ChatGPT Search and Deep Research FAQ. Treat non-search outputs as zero presence for visibility scoring unless a verifiable link is included.
Measurement limitations you should disclose
- CTR uncertainty: There’s no standard CTR curve for AI modules. Industry reporting observed that when AI Overviews appear, classic organic CTR can decline for some query classes; for context, see the November 2025 coverage discussing organic CTR drops associated with AI Overviews. Use conservative relative weights and document your assumptions.
- UI volatility and eligibility: AI answer formats and eligibility evolve. Revisit your rubric quarterly and annotate notable changes in your monthly report.
- Personalization and prompt drift: Small phrasing changes can alter answers. Keep prompt wording consistent and archive all snapshots so you can explain short-term swings.
Reporting tips
- Show the overall score alongside per-engine sub-scores and sentiment breakdowns.
- Benchmark against 3–5 named competitors on the same prompt set.
- Track month-over-month deltas and add notes for major UI shifts.
Actionable Checklist and Next Steps
- Define a 25–50 prompt set across intent types and lock it for a month.
- Draft a one-page rubric for presence, prominence, expected clicks, and sentiment (with examples).
- Timebox data capture to a tight window; store screenshots and citation lists.
- Run the calculation, plot per-engine sub-scores, and compare to 2–3 competitors.
- Review assumptions quarterly; adjust only with documented rationale.
Here’s the deal: you don’t need perfect data to start. A small, consistent pilot will give you a defensible baseline in 30 days—and a clear path to improving your brand’s visibility inside AI answers.